Detection monitoring of cracks with Digital Image Correlation: a choice tool
- By Floriane Soulas, R&D engineer at EikoSim
Context
Some structures have a long service life from commissioning to replacement. These structures, when they have a fundamental role, must be able to maintain their physical integrity throughout their service life. To do this, it is essential to ensure their reliability over time.
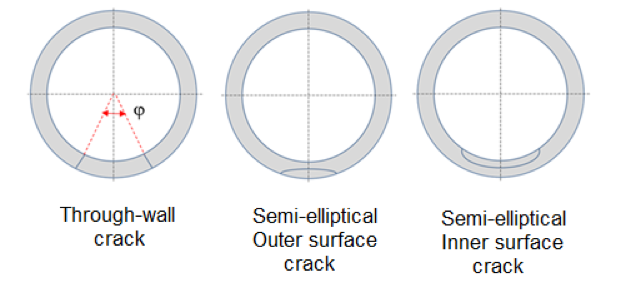
In the case of such structures as metal water pipes, different types of damage may occur in operation but the most harmful is the opening and propagation of cracks in the pipes (fig. 1). To prevent this irreversible damage and to intervene in time, numerical simulations are carried out making it possible to predict the damages due to the aging of the pipes.
In this context, the test discussed in this article is dedicated to the follow-up of crack opening and propagation on a specimen subjected to bending in order to allow the registration and the validation of a numerical law of behaviour for the cracking of the material of the pipeline.
Crack propagation tracking by stereo correlation measurement
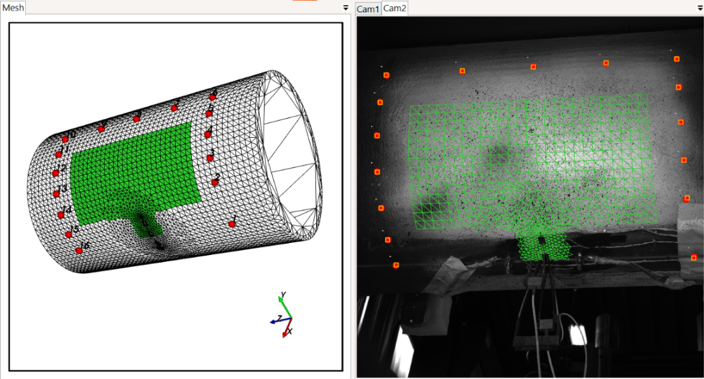
For this demonstration, a pre-crack was performed in a test tube. A pair of cameras are arranged to observe the area of interest and the propagation of the crack in the direction predicted by the numerical simulation.
The study area (in green in Fig. 2) and the pre-calibration points (in red) are defined directly from the finite element mesh provided by the customer (in our digital image correlation software) before the loading.
The result of the measurement will be expressed directly on the FE mesh, which allows an immediate comparison with the fields of displacements predicted by the simulation for the solicitation considered.
Determination of the crack tip
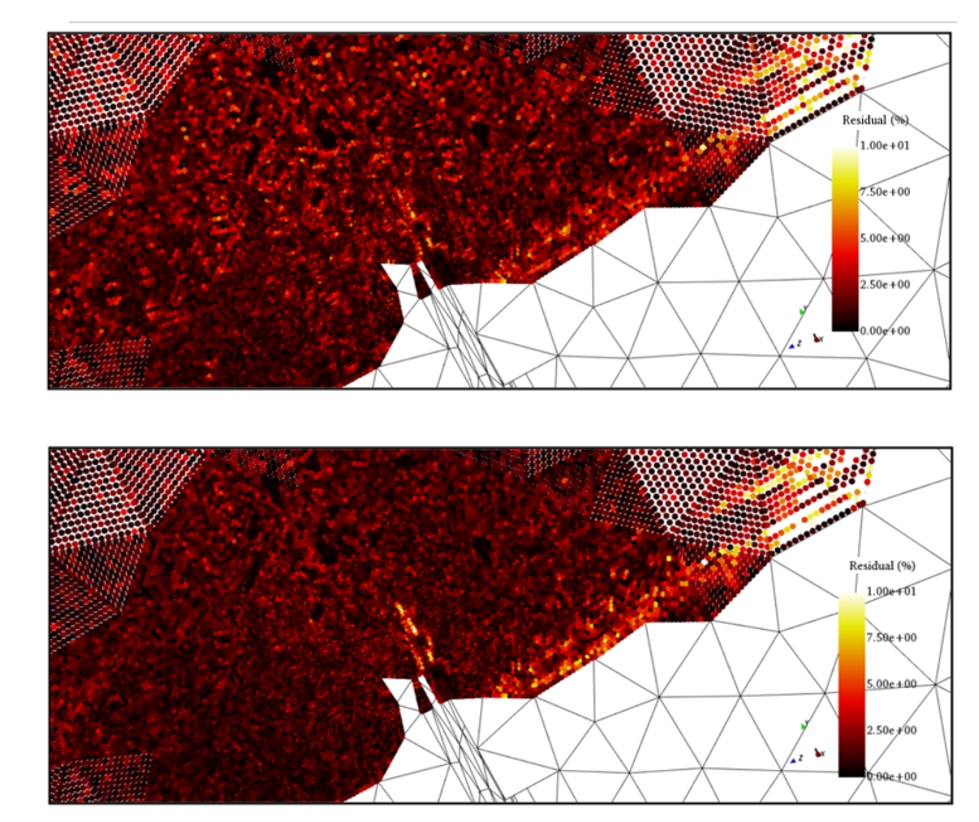
In order to follow the evolution of the crack over time, we are particularly interested in the calculation of the residuals. Indeed, the residuals calculated in EikoTwin DIC make quantifying the overall correlation error possible.
The residuals correspond to the difference between the reference image (the first image) and the distorted image, corrected for the measured displacement field. It is calculated for each evaluation point of the correlation calculation, thus allowing us to follow “in real time” the appearance of the crack.
Fig. 3 presents two successive images during which we can see the beginning of the crack through the display of measurement residuals (in yellow at the level of the pre-crack).
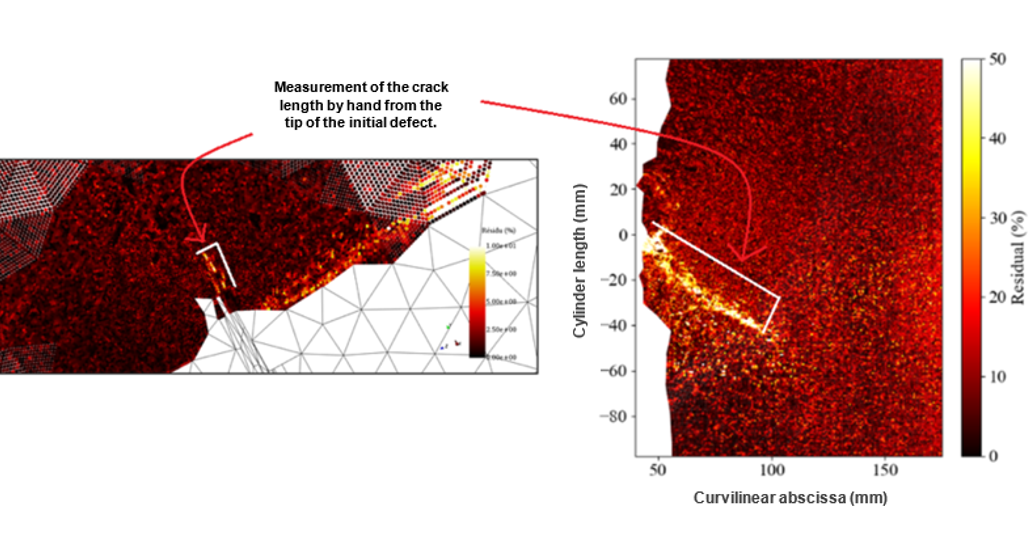
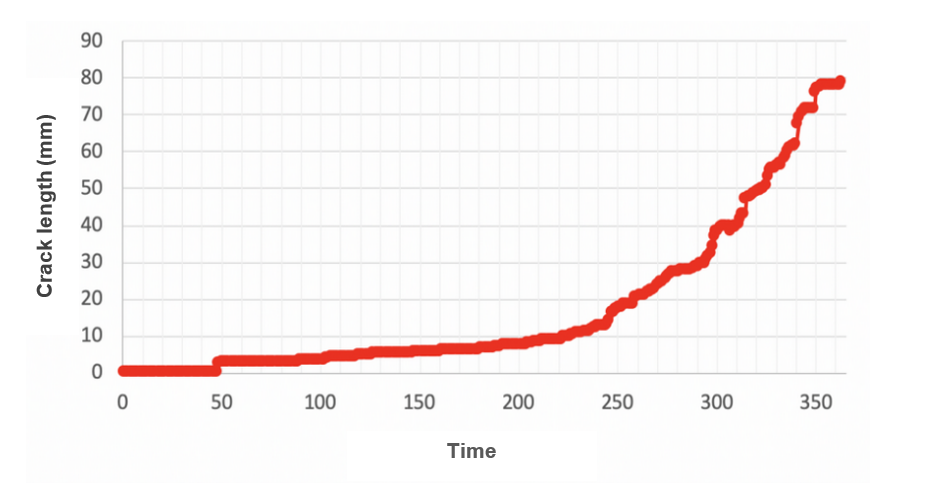
The position of the crack tip is collected by hand, frame by frame, as shown in Fig. 4. This is a propagation length from the tip of the initial defect whose position is taken prior.
At most, the operator uncertainty on this measurement is evaluated at about 0.2mm for each image.
Following the crack spreading over time
Thanks to the cartography maps, it is possible to follow image by image the evolution of the crack and to recover the coordinates of the crack tip over time. By extracting this position image by image, it is thus possible to measure the length of the crack on all the images (length relative to the tip of the initial defect) and thus trace its evolution.
Fig. 5 presents a selection of maps allowing us to visualize the appearance and the evolution of the crack from its primer to the end of the test. Fig. 6 traces the evolution of the length of the crack over time.
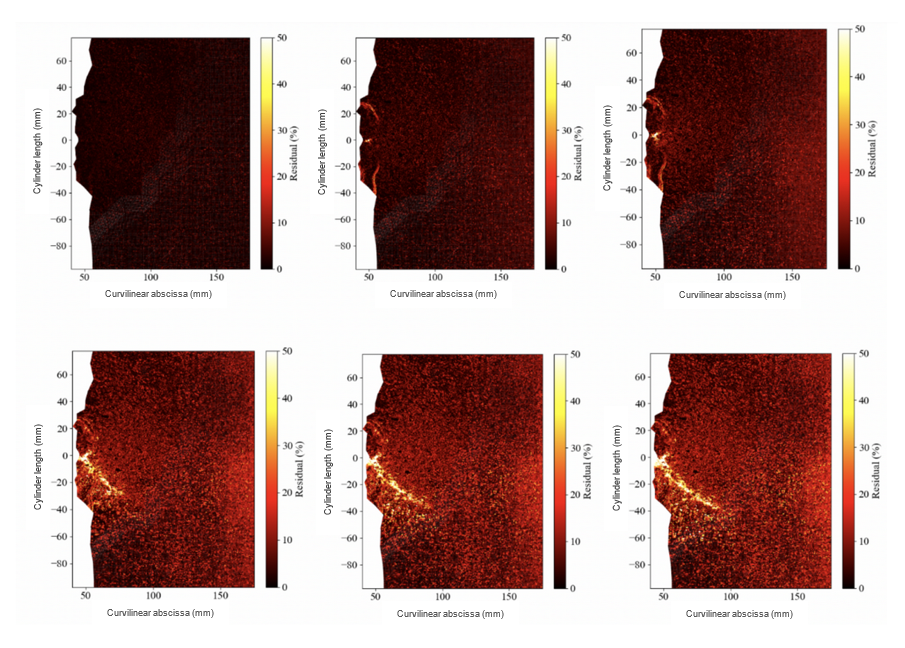
In conclusion, we can draw a great wealth of data from this test. Stereo-correlation makes it possible to provide 3D displacement and deformation fields and detect, monitor, and measure the appearance and propagation of a crack during a dedicated test on a test piece subjected to instrumented flexion, via the study of cartography maps. The mappings obtained make it possible to clearly visualize the appearance and propagation of the crack during the test and to measure its evolution quantitatively.
98-100 AVENUE ARISTIDE BRIAND
92120 MONTROUGE
FRANCE