Crash-test and image correlation: how to measure seat deformations and follow the dummy’s movements
- By Alex Chang, Project engineer
- Feasibility study: application of EikoTwin tools for a crash-test
- Virtual test – DIC measurement – comparison test calculation

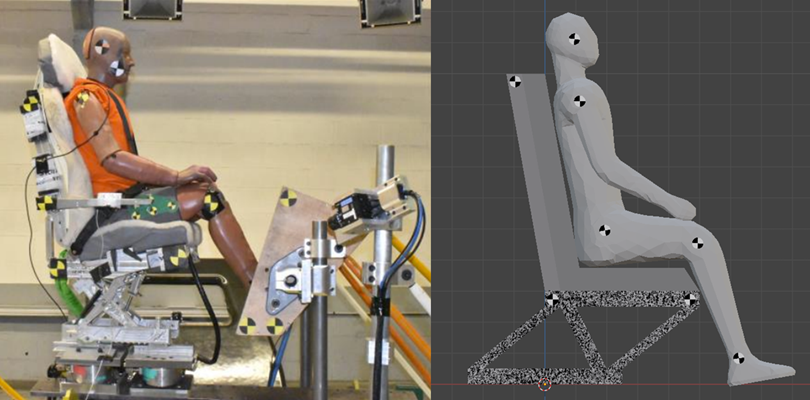
Crash tests are crucial in developing and certifying products, especially for the automotive, aeronautical, and railway industries. These tests simulate collision or impact scenarios in order to evaluate the resistance and safety of products. Among the equipment used to perform these tests is the reverse catapult, which is a device that projects an object, in this case, the dummy and its seat, at high speed, creating a force pulse that simulates a high-intensity impact. Localized strain gauges have long been used to measure a seat’s deformations during a crash test.
However, these gauges do not allow measuring the seat’s whole deformation field. Therefore, image correlation has been proposed to measure seat deformations. This measurement also allows us to follow the displacements of the dummy from targets strategically positioned on some parts of its body.
The interest is to use the same camera system to measure the seat deformations and the mannequin displacements by tracking markers. Image stereo-correlation is used to measure the deformations at various places of the seat, in particular, to control a possible weakness detected by calculation, to adjust the dimensions of the components according to the measured constraints, or to provide data for the calculation in the complex zones to be modelled or simulated.
In this crash-test case study, we used EikoTwin Virtual software to create a virtual crash-test environment, position the stereo camera system, and record images of the test.
Then, we processed the images with EikoTwin DIC software to calculate the dummy’s displacements and the seat’s deformations.
Creation of a virtual crash test with EikoTwin Virtual for image correlation
Virtual test principle
In the context of the creation of virtual tests, the use of modeling and 3D rendering software is essential. From this point of view, the Blender software, initially developed for the animation film industry, proved to be a particularly interesting tool for our use.
It allows the creation of cameras with all the necessary characteristics to position them, photograph, and export images with a realistic rendering of materials and lights. Although Blender was originally intended for the animation industry, we have used this software to convert it into a tool suitable for image correlation and the creation of virtual tests.
EikoTwin Virtual consists of the ModelConverter tool and the BlenDIC add-on. ModelConverter allows converting a model and simulation results created in finite element software such as Abaqus or HyperWorks into VTK format that can be imported into Blender. The BlenDIC add-on integrates the necessary tools in Blender for the creation of virtual tests.

We created a simplified model of a mannequin on a seat using Abaqus, to which we applied stresses to simulate displacements similar to those of a crash test. Then we imported this simulation into EikoTwin Virtual.

EikoTwin Virtual: speckles & Markers
First, we applied a speckle on the seat in order to allow deformation measurements by image correlation. Markers were also placed on certain areas of the mannequin (head, shoulder, hip, knees, ankle) to follow their movements during the test.

EikoTwin Virtual: camera positioning
The two cameras are positioned in the space, covering the entire area of interest. A specific angle of 30° is respected between these cameras, and the zone of sharpness is identified.


EikoTwin Virtual: camera views
The images captured by the two cameras are rendered in real-time on Blender.

Blendic: speckles: size & resolution
Taking into account the resolution and the field of view of the cameras, the optimal size of the speckles can be determined (here 2,5 mm).
It is important to have several spots per mesh element and several pixels per spot to allow convergence in image correlation, as seen in the images.

EikoTwin Virtual: generation of virtual images of crash-test for image correlation

The last step in creating the virtual trial on EikoTwin Virtual is to generate and export the virtual images.
Validation of the feasibility of the measurement with the EikoTwin DIC software
EikoTwin DIC: post-processing of the virtual images
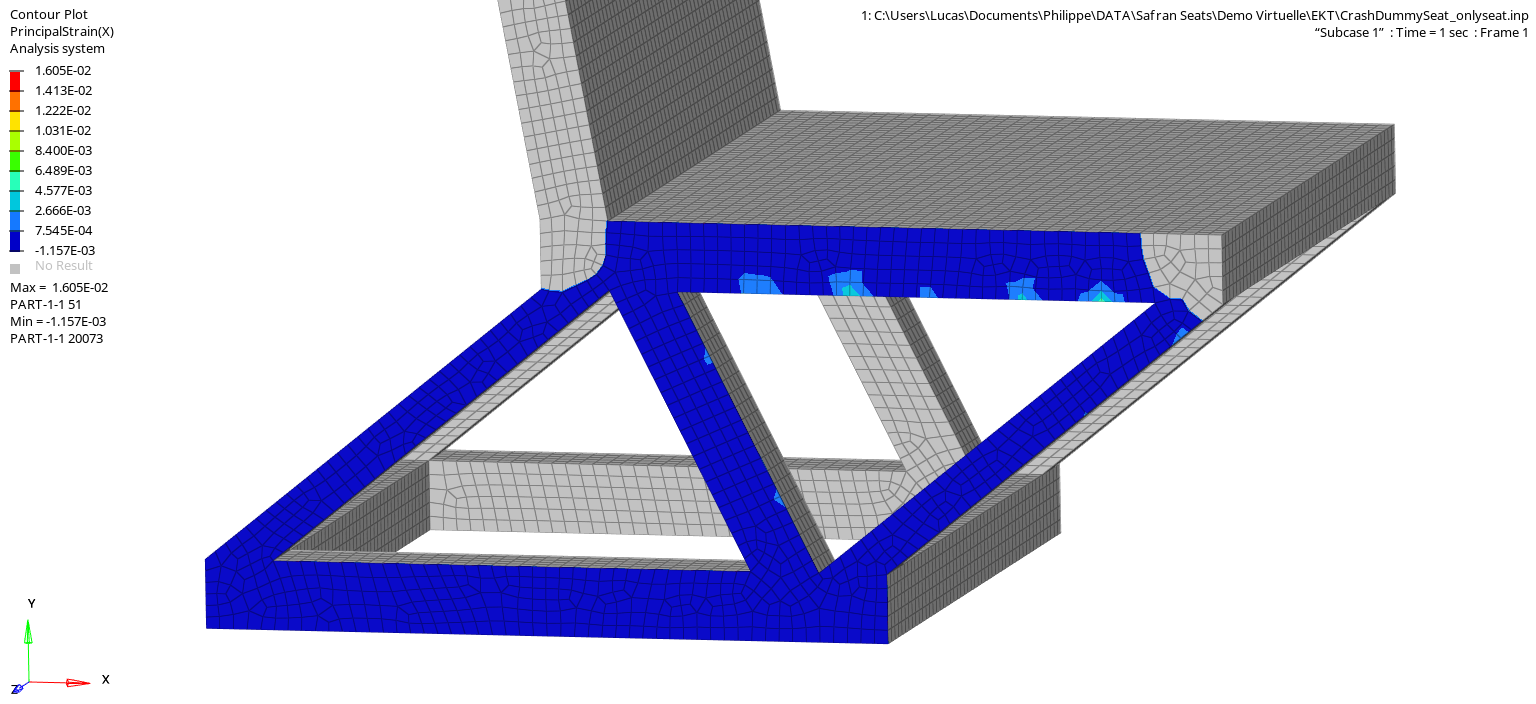
After obtaining the test images, the next step is to use the EikoTwin DIC software to evaluate the convergence of the image correlation calculations. This step is critical to verify that the resulting images can accurately measure the deformations and displacements of the part. After importing the images and mesh into EikoTwin DIC, a crucial step is to perform the camera calibration. This step calculates the projection matrix of both cameras from the images.
Once this step is completed, the simulation mesh can be projected onto the images to allow the measurement of displacements and deformations on the part.

Measurement results by image correlation of the crash-test
EikoTwin DIC: displacement calculation | results
Once the calibration was completed, the displacement calculations were performed, and here are the results obtained:
EikoTwin DIC: comparison test / calculation | displacements
The EikoTwin DIC software makes it possible to directly visualize the displacement difference field between the test and the simulation. Since the virtual test is created from the simulation, theoretically, the differences should be zero. This difference, therefore, informs us about the accuracy of our measurement and the minimum uncertainties that could be encountered in a real test.
Figure 14 Evolution of the field of differences in seat displacements as a function of time (video)
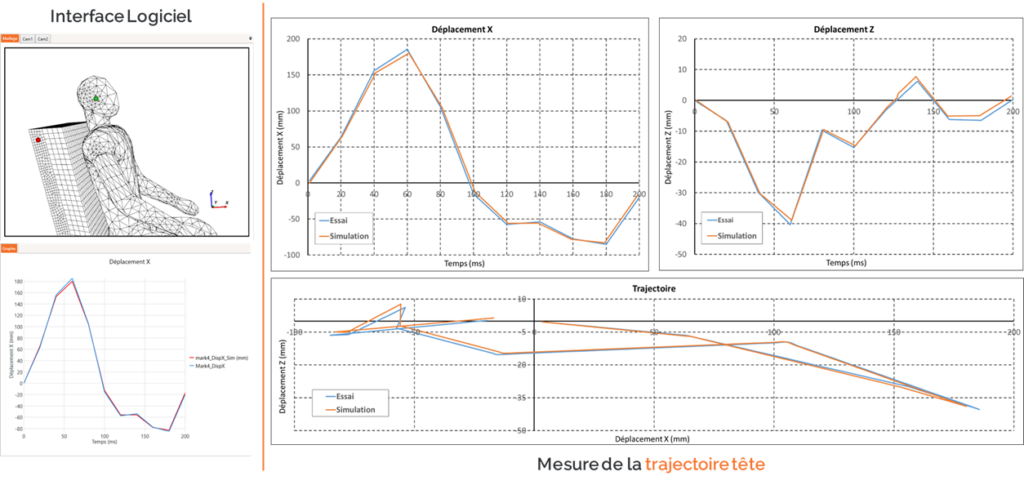
EikoTwin DIC: tracking of markers
Another interesting feature of the EikoTwin DIC software is the tracking of markers. We placed markers on the mannequin in the first step to measure its movements. By importing the images into EikoTwin DIC, it is possible to indicate the position of the markers in each image and to measure their displacement over time.
In the software interface, the calculated point for the marker and the resulting curve can be seen in the 3D view. The results for the head marker are plotted for the displacements along the X and Z axes as a function of time, as well as the trajectory of the head by plotting the Z displacements as a function of the X displacements. It is possible to compare the results between the tests and the calculations on the graphs.
HyperWorks export
The last step in EikoTwin DIC, exporting the results. Exporting the results in different formats to suit different modeling software is possible. The results can then be imported into HyperWorks, as shown here.

Timeline
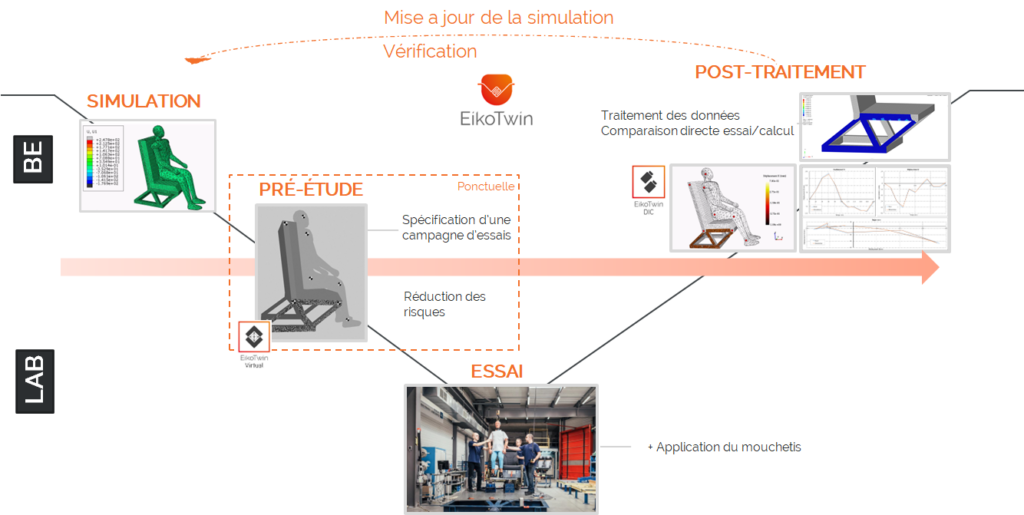
In the context of a shock test, we have written this timeline which presents the dialogue between test and calculation.
The timeline has two stakeholders: the Design Office and the Test Laboratory. The Design Office has performed the crash test simulation and wants to verify and improve the results of their model. Therefore, they need the laboratory to conduct a real crash test. The measurements are carried out with several cameras.
To avoid difficulty positioning these cameras during the real test, the design office and the laboratory carry out a pre-study with EikoTwin Virtual. This one-time step allows to specify the test campaign and to reduce the risks, and it should only be done once. On the day of the test, an additional step is added to the process: the application of a speckle to perform the image correlation.
The laboratory then sends the images to the design office for post-processing of the data and comparison between the real test and the simulation with EikoTwin DIC. Finally, the design office can use the test results to check and, if necessary, update the simulation with EikoTwin DigitalTwin.
Conclusion
In summary, this paper presents a feasibility study on the use of EikoTwin tools for crash testing. The use of digital image stereo-correlation allows for the measurement of the entire seat deformation field and the tracking of the dummy’s displacements from targets strategically positioned on certain parts of its body. The virtual test created with EikoTwin Virtual was used to simulate images of displacements similar to those of a crash test, and these images imported into the EikoTwin DIC software were used to measure seat deformations and dummy displacements with high accuracy.
The results obtained are promising and show the potential of EikoTwin tools to improve the efficiency and accuracy of crash tests in the automotive, aerospace, and railway industries. The use of these tools could lead to a better understanding of product deformation and failure mechanisms and reduce development costs and time.
In sum, this feasibility study is a step towards the wider use of EikoTwin tools in the industry and opens up new opportunities for innovation in crash testing.
98-100 AVENUE ARISTIDE BRIAND
92120 MONTROUGE
FRANCE