Sources of measurement errors with digital image correlation
- By Clara Minguet, Research engineer at EikoSim
In digital image correlation as in any measurement process, errors affect measured data. The characteristic of this method lies in the direct dependency between the test and the measurement error [1,2,3]. Indeed, errors need to be estimated for every new test. These errors can be classified in two categories: the bias corresponding to systematic errors and the uncertainty corresponding to random errors. For more details about bias, uncertainty and the way to quantify them, check out the dedicated article on our blog. In this article, we will introduce the various sources of these errors (bias and uncertainty) that can affect measurements by digital image correlation. These sources could be divided in two types. First, the sources of errors related to testing and post-processing, that can and must be mitigated by the user to make displacement measurements more reliable. Second, those related to the implementation of the digital image correlation code, over which the user usually has little control. This second type of sources of measurement errors will not be developed in the following as it will be the topic of a future blog article.
Sources of errors related to the test
Among the sources of errors occuring during a test instrumented by digital image correlation, there are sources specific to test hardware and more precisely to cameras, sources specific to test environment and sources related to speckle patterns.
Sources of errors associated to test hardware: stationary noise from camera sensors
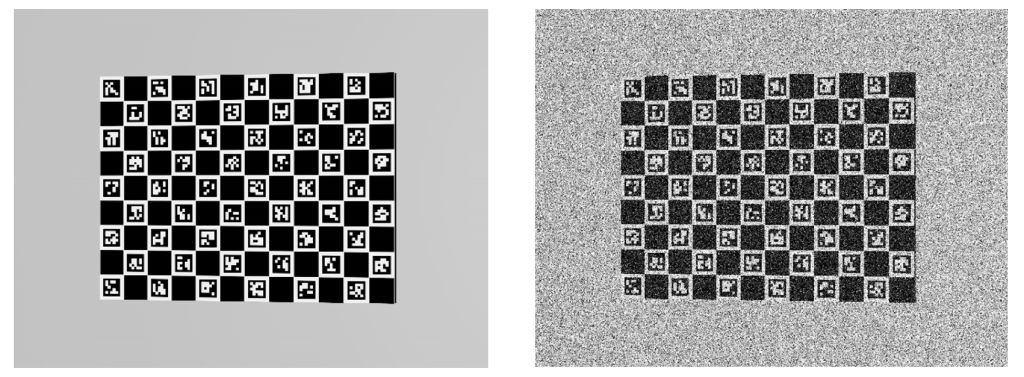
This digital noise from the cameras corresponds to a temporal variation of the gray level of each pixel around its “true” value, independently of its neighbors and of the time step. Its associated noise model is always white gaussian or poissonian. This effect, depending on sensor quality, induces a degradation of the signal quality. Indeed, for lower quality sensors, the image can even appear “grainy” to the eye (see Figure 1). The resulting impact on displacement measurement is of the order of a hundredth of a pixel for a standard CMOS/CCD sensor in good condition. There are several digital noise sources. The 3 main ones are photon noise due to temporal variation of the photon flux, readout noise that is an uncertainty on the measurement of electric current depending on sensor gain and thermal noise due to the rise in temperature of the camera.
The equivalent of digital noise for an IR camera is the NETD (Noise Equivalent Temperature Difference), of the order of few mK. This is the smallest detectable temperature difference.
Sources of errors related to the test environment
- Illumination quality
Poor illumination and variations of brightness/contrast in space and time [4] multiply the “standard” uncertainty level by 10 leading to an uncertainty on measured displacements of the order of a tenth of a pixel. For the second point, lighting should be adjusted so that it is homogeneous and constant throughout the test. To this end, the lighting conditions of the test site must be analyzed beforehand and should be controlled as well as possible, even though this might be cumber some in some environments, in particular in places with a strong natural light.
- Atmospheric turbulences
Convective currents called heat waves can appear during a test instrumented by digital image correlation [5]. This phenomenon causes an apparent distortion of the images and therefore corrupts the displacement measurements. It is of course common for a high-temperature test. However, it can also occur during a long test carried out at room temperature due to air heating by the lighting device or even the testing machine. The parasitic displacement amplitude is naturally not equivalent in the two cases. Indeed, for a room-temperature test, amplitudes typically range from 0.1 to 0.5 px while for a high temperature tests (above 600°C), the amplitude can reach several pixels. Whatever the case, convective currents can have a strong impact on measurement uncertainty. For a room-temperature test, they multiply the “standard” uncertainty level by 20 leading to an uncertainty on measured displacements of the order of 0.2 px. A common solution to reduce atmospheric turbulences is the use of an air knife between the cameras and the testing part to create a laminar airflow.
- External biases
During a test instrumented by digital image correlation, external biases can occur. Two types of external biases may be encountered: permanent biases like vibrations transmitted from the floor or unexpected ones like a motion of cameras or of a LED panel during the test. The clear delimitation of the test area is already a first measure to carry out in order to limit unexpected external biases that may be caused by inadvertent movement in the test vicinity.
Sources of errors associated to speckle patterns
- Speckle pattern quality
The speckle pattern is a key element in digital image correlation. It has to be matte to avoid reflections on the surface of the part of interest. Moreover, a good speckle pattern has a random spot distribution and a high contrast level between dark and light spots. In short, the associated gray level histogram should be spread out with an equivalent distribution of white and black.
- Ratio between speckle size and pixel size
In addition to the contrast, the matte finish and the random nature of the speckle pattern, it is essential for the speckle size to be large enough in comparison with the physical size of a pixel to avoid or at least reduce associated errors. Indeed, there must be enough pixels per spot in the images. A minimum spot size of 4 pixels diameter is recommended.
- Ratio between speckle size and element size
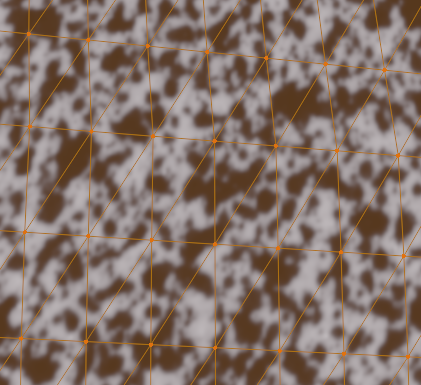
Another rule constrains speckle size. In practice, there must be enough contrast per measurement area or in other words, enough spots per element in the context of the FE-based global method (see Figure 2) or per subset for local methods. At least 4 spots per measurement area are recommended.
In order to minimize errors due to speckle size, don’t hesitate to use the spreadsheet available on our website.
Sources of errors related to post-processing
Errors occuring during the post-processing of test images come from the selection of pre-calibration points by the user and the use of regularizing strategies.
- Selection of pre-calibration points (specific to EikoTwin DIC)
With EikoTwin DIC, to initialize the cameras calibration algorithm, the user has to manually select pre-calibration points at the same locations on the reference images and on the finite element mesh. The choice of these points necessarily differs from one user to another. However, the resulting error can easily be minimized by carefully clicking the points and by respecting a list of criteria.
- Application of regularizing strategies (filtering, mechanical regularization)
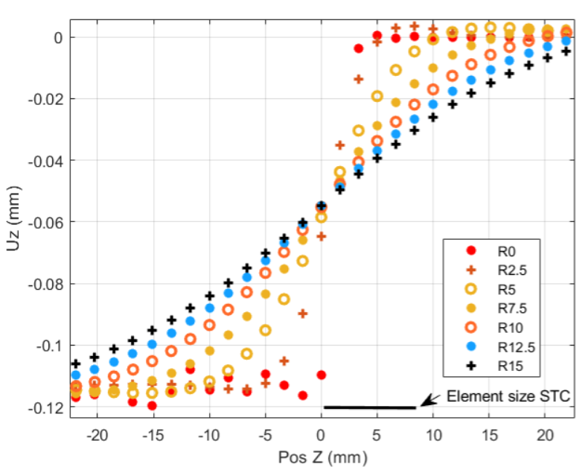
Regularization allows to reduce parasitic spatial fluctuations of the displacement field computed with a digital image correlation software. Filtering and mechanical regularization can be thought of as low-pass filters, the first one applied to the measured solution field and the second one directly into the algorithm by integrating assumptions of compatibility of the strain fields with fundamental mechanical equations. In both cases, a user choice of overly strong filtering or high regularization lengths compared to the experimental strain gradient leads to oversmoothing of the measured data. This choice must therefore be done rigorously because it is a source of bias on the measured quantity [3] (see Figure 3).
One of the advantages of mechanical regularization compared to generic filtering is the direct link between the relevant regularization length and the physics of the observed phenomenon. By comparing this length with a simulation result for the given test, the user will immediately see if the chosen length is relevant with respect to the expected strain gradient. It can also be pointed out that a field regularized by this technique is mechanically admissible, unlike direct application of a gaussian filter on the measured displacement for instance.
Towards a better integration of measurement errors…
To summarize, uncertainties and biases sources on digital image correlation measurement are wide-ranging. However, most of these errors can be limited by a rigorous test preparation and setting up. To validate the measurement, it is important to evaluate the background noise of a test so as to ensure that signal can be distinguished from noise in the measured data at any given moment. Furthermore, there is an effective way to determine measurement uncertainty a posteriori from images taken at rest during the test. For this purpose, an uncertainty computation module will be available by the end of 2021 in the EikoTwin DIC software. In addition, thanks to a pre-study with the EikoTwin Virtual software, it is already possible to estimate a lower boundary of the uncertainty before a given test campaign. Indeed, during the pre-study, most of the errors sources listed in this article are taken into account, as close as possible to reality. This upstream work allows the user to validate his test setup, or to modify it to reach acceptable uncertainties estimations.
If you wish to learn some more on the subject, we highly recommend that you download and check out the good practices guide for digital image correlation [3] edited by iDICs.
References
[1] André Chrysochoos, Yves Surrel. Basic elements of metrology and introduction to the various techniques in: Full-Field Measurements and Identification in Solid Mechanics, Michel Grediac (Editor), Francois Hild (Editor). Wiley-ISTE, 2012, 978-1-118-57847-6.
[2] Reu, Phillip L., Miller, Timothy J., Sutton, Michael, and Wang, Yanqing. Uncertainty quantification for digital image correlation. United States: N. p., 2009. Web.
[3] iDICs, A Good Practices Guide for Digital Image Correlation: Standardization, Good Practices, and Uncertainty Quantication Committee, October 2018.
[4] F. Hild and S. Roux, Digital Image Correlation in: Optical Methods for Solid Mechanics:A Full-Field Approach. P. Rastogi and E. Hack, eds., Wiley-VCH, Weinheim (Germany, 2012), pp. 183-228.
[5] Jones, E., Reu, P. Distortion of Digital Image Correlation (DIC) Displacements and Strains from Heat Waves. Exp. Mech., 58, 1133–1156 (2018).
98-100 AVENUE ARISTIDE BRIAND
92120 MONTROUGE
FRANCE