Previsualization with Blender of a complex structural test

Written by Matthieu Vitse
Matthieu Vitse is a freelance scientific visualization expert. He has a PhD in computational mechanics from ENS Paris-Saclay, and his main activity now focuses on the post-treatment and visualization of large complex data simulations and experiments.
More info at www.sciviz.fr
(from Vitse et al. Toward virtual design and optimization of a structural test monitored by a multi-view system, submitted to SAGE 2019)
Introduction
Visualization is an essential element in today’s mechanical engineering, mostly because of the amount of data to process, in experimental mechanics as well as on its computational counterpart. Those visualization aspects also appear to become more and more important on the pre-process of the experiments. Indeed, the complexity of the models to identify require the design of more and more complex experimental setup, the sophistication being either put on the testing machine, its instrumentation or the specimen itself (or a mix of all of them).
Let’s take an example of concrete reinforced beam subjected to seismic loading. The understanding of the behavior at the beam-column joint is particularly important as this element has a very strong influence on the global mechanical response of the overall structure, due to the complexity of the assembly (steel reinforcement bars, anchorage and stirrups) and the occurrence of several coupled physical phenomena (damage, crack nucleation, growth and arrest, debonding of concrete from steel reinforcement, friction, wear of crack surfaces, role of debris …).
One way to study such key element is to resort to full-field measurements in order to obtain a complete picture of the joint of the beam-column assembly. However, one must remember that even though the geometry is mostly planar, the occurrence of damage within the concrete elements will probably break the symmetries and therefore break the planar feature of the geometry. Stereo-correlation systems offer solutions to capture the 3D kinematics of the surfaces [1].
In addition, it is favorable to observe the joint, the column and the beam over different faces, and also different scales [2] to capture both the detail of the joint degradation and also the large scale deformation of the beams in order to characterize the loading conditions using beam theory. Because these objects are slender, in general, a global view will not have the sufficient spatial resolution to capture the details. These different requirements and constraints lead to a highly complex setup, as shown on Fig. 1: a cumber- some specimen (1), attached to a machine having a complex geometry and many mobile parts (2), and captured by several cameras (3).
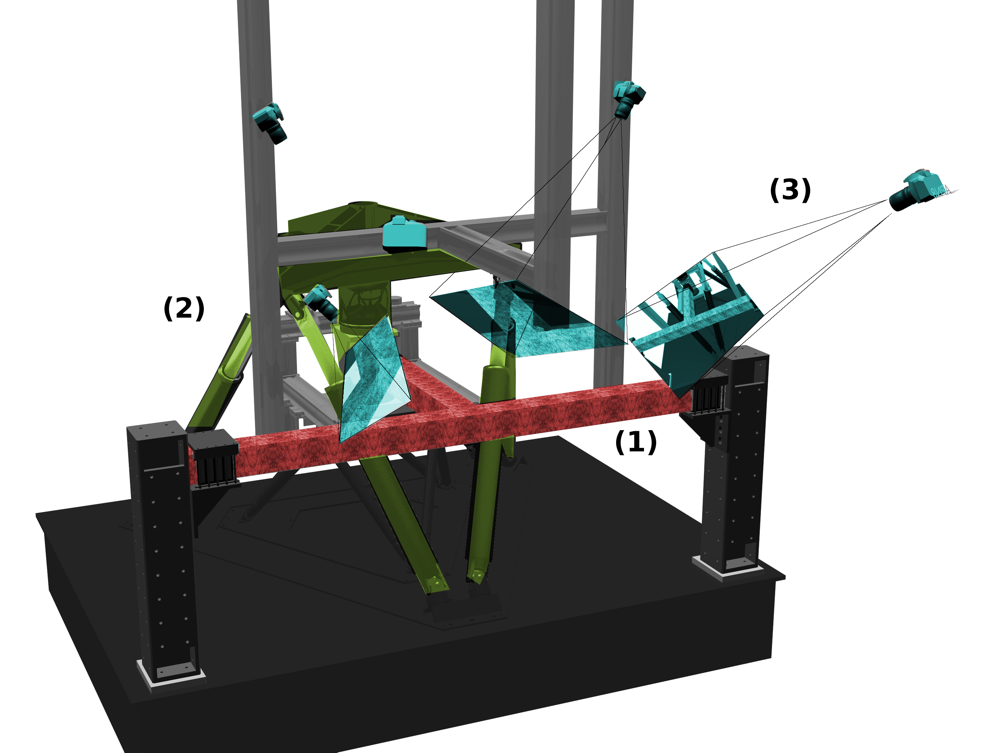
Figure 1 – Blender rendering of the experimental (partial) setup (1) T-shape specimen (red), (2) multiaxial testing machine (yellow), (3) several cameras capturing the scene (blue)
Many cameras are then simultaneously required to capture the kinematics of the joint, which add a lot of freedom and constraints in the global setup of the experiment (camera sensors, lenses, light sources, positions and orientations, …). Rather than resorting to a « trial and error » approach to position the cameras, the objective is to present a procedure to pre-design the experiment using 3D rendering softwares.
This technique has been used in the movie industry for decades during the pre-production phase under the name of « blocking ». It is either performed on set, or using mockups with simpler geometries, in order to determine the position of the actors, the position and motion of the cameras, especially in crowded or cramped spaces. It is also widely used for 3D computer animation movies for the same reasons as the one given above, but also to avoid non-realistic movements of the characters.
Although the needs of the movie industry are very different from the ones of experimental mechanics. However, visualization softwares are naturally accurate in their geometrical rendering, and this property can be extremely beneficial to the design of complex mechanical tests including the optimization of camera positioning. In the following sections, we present how a free and open source computer graphics software, Blender [3], is used in order to determine the characteristics, orientation and position of the cameras for the very complex setup presented in Fig. 1. Section 2 presents the experimental setup. Then, the image acquisition together with the model of the geometry in Blender are presented in section 3. Section 4 covers aspects related to the surface coverage or possible shadow obstructions and lead to the validation of the setup prior to its construction.
Experimental setup
Because of the 3D aspects of the kinematics of the structure, it is necessary to combine at least two different points of view to achieve a 3D (surface) measurement of the displacement field. However, this statement is to be repeated for all beam sections and column connected to the joint. Moreover, as the damage may occur on the entire apparent free surface, it is necessary to have multiple complementary views surrounding the setup, and thus many cameras are to equip the experiment. The overall setup is technically complex (Fig. 3).
The length of each half column is equal to 1140 mm and that of the beam to 1000 mm. The cross section of the column and beam being 120×120 mm2, the joint is a 120×120×120 mm3 cube. It is made out of Portland cement with usual reinforcements and several high strength steel bars — anchored in the joint regions by 90◦-hooks — for longitudinal reinforcement in the column and beam sections. For more details see [4].
The surface texture necessary for the digital image correlation (DIC) algorithm [5, 6] is obtained by firstly applying a paint coating, in order to get a white background, then a combination of stencil technique leading to a pattern of 2 mm diameter black dots and finally a black manual brushstroke in order to break the regularity of the pattern (see Fig. 4(b)).
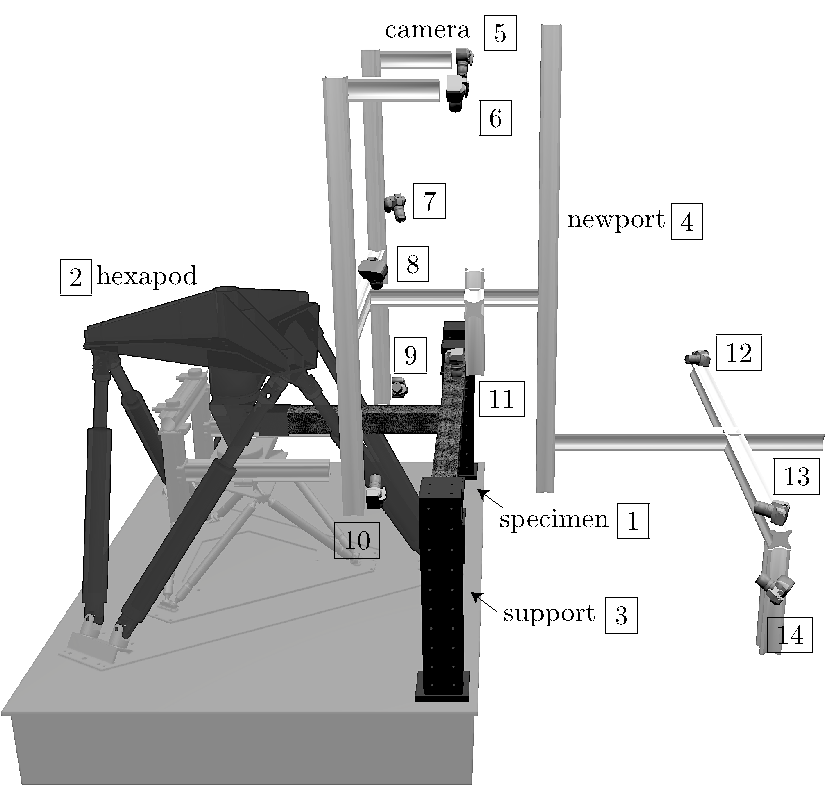
Figure 2 – View of the entire setup. (1) reinforced concrete specimen, (2) hexapod testing machine, (3) support of the specimen, (4) Newport bars for the fixation of the cameras, (5-14) digital cameras.
The testing machine is a hexapod (Fig. 2), i.e., a 6-axes parallel machine. Apart from very few exceptions ([7, 8, 9, 10, 11, 12]), this type of machine is still rather rare for material or structure mechanical testing, although it offers very versatile and complex loading capabilities. Using six electromechanical actuators, it allows an overall translation (resp. rotation) range about ±250 mm (resp. ±22°) in every direction (the actual range of translation and rotation is complex because of the non-cartesian parallel structure of the machine).
As seen in Fig. 2, the specimen is supported in horizontal position, with each end glued inside steel helmets which are attached to two metal columns ([#3] on Fig. 3) fastened to the steel slab. The last helmet is related to the load cell through a spherical joint with an initial zero clearance.
The specimen is loaded with a combination of horizontal (Uy) and vertical (Uz) translations at the extremity of the beam using different loading histories. They aim to investigate states that can be encountered by a reinforced concrete joint during an earthquake loading (here in quasi-static conditions), and in particular the coupling between different crack patterns developed in different bending directions.
Image acquisition
Due to the complexity of the experiment presented in the previous section, the requirements for an accurate measurement of the kinematic of the beam are multiple:
- Cameras must be simultaneously triggered
- Cameras must capture different faces of the specimen
- The cameras position and orientation are set to perform stereo-digital image correlation (i.e., at least two cameras must capture the same region)
- The different parts of the setup (including cameras and lightings) must not overshadow some areas of the specimen from the concerned camera
- The regions of the specimen framed by the cameras must be uniformly illuminated.
The calibration of numerous cameras can be very time consuming, which makes the testing machine unavailable for a long period of time. The solution proposed here to reduce these costs consists in modeling the entire experiment into a 3D modeling and rendering software. The testing machine and the specimen (including its fixtures) can be described accurately from their CAD descriptions which are readily available. The main interest here relies in finding « good » points of view for the digital image correlation analysis, in a sense that the cameras must adequately cover the targeted areas as well as be placed in a way that no other object may obstruct or obscure the area of interest. The position of the cameras along the Newport bars system, as well as the choice of the cameras itself and their lenses, the position of the extra lighting systems, all of these features may be determined prior to setting up the actual experiment, in an approach which will be called « virtual experimental design ».
Central to the approach is the recourse to an open-source 3D-modeling and rendering software, Blender. Although its main field of application is animation movies or aesthetic 3D-rendering (as can be seen from the website [13]), it has the capability of reproducing very accurately 3D scenes, in a quantitative fashion (no limiting geometric approximations are included). Hence the very photo-realistic rendering is the main motivation for using this software. Additionally, its versatility, its flexible interface, and its material and texture modeling features are very convenient and powerful characteristics that are exploited here to generate virtual pictures from the test. One can control the texture and aspects of the materials used, the intensity of the lighting and the specifications of the cameras used for the rendering.
1. Visualization pipeline
The visualization pipeline (see Fig. 3) is the following: the testing machine is modeled and decomposed into different subsets in the CAD software (in this case CATIA V5) and each subset is imported into Blender, using the .stl file format, widely used for rapid prototyping or 3D printing as it describes efficiently the surface geometry of 3D objects (without any representation of color or texture), enabling different visual treatments for each of them in Blender (in terms of material or texture properties). Different lights and cameras are added to the scene.
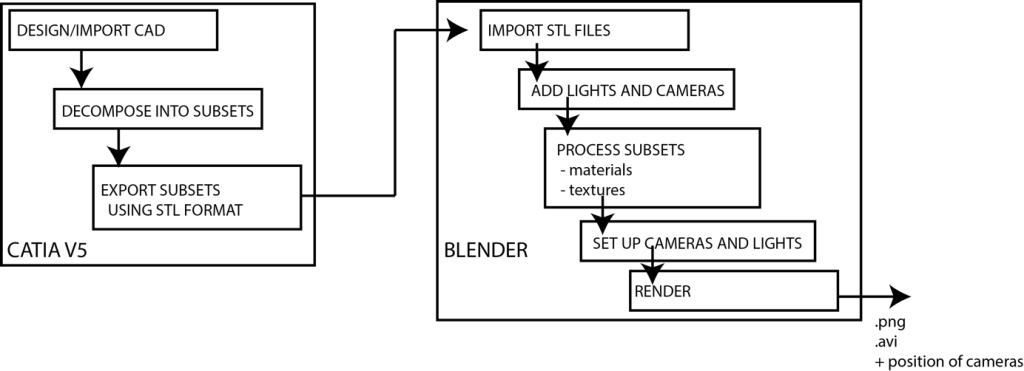
Figure 3 – Visualization pipeline: the geometry of the experimental device and the beam are pre-processed in CATIA prior to be fed to Blender where the environment (lights, cameras) is setup and tuned, materials and textures properties of the sample are defined and camera images rendered
2. Parameterization of the cameras
In the real setup, cameras can nearly freely be moved along Newport bars surrounding the hexapod (see Fig. 2) in order to find « good » positions, this operation is however very time consuming when numerous cameras have to be set up. One can mimic such degrees of freedom in Blender by linking the cameras to paths, for example lines along the different Newport bars, which are described using non-uniform rational B-splines (NURBS), such that the trajectory of the camera can be configured. An area of interest can be specified, such that the camera keeps focusing on a given point (with additional constraints such as horizontality, for example).
3. Texturing of the beam surfaces
To improve the rendering of the specimen, a picture of the speckle was taken on the actual beam. This is achieved by using the UV-mapping functionality of Blender, a technique which enables to map this texture to the virtual sample by projecting the 2D image of the speckle to the 3D surface:
- the beam surface (Fig. 4(a)) is « unfolded » to create a UV-map (Fig. 4(c)),
- the picture of the speckle (Fig. 4(b)) is overlaid on the 2D map (Fig. 4(d)),
- the beam is finally “wrapped” back on the 3D object with the new texture (Fig. 4(e)).
It is to be mentioned that by adding x and y symmetries to the sample on the UV map, one can create a seamless speckle, in order to avoid a great number of discontinuities on the texture when wrapping up again the object. Although those texturing aspects are not mandatory for the positioning of the cameras (even if they can provide additional information to the expert), they are of major importance when evaluating the measurement uncertainties.
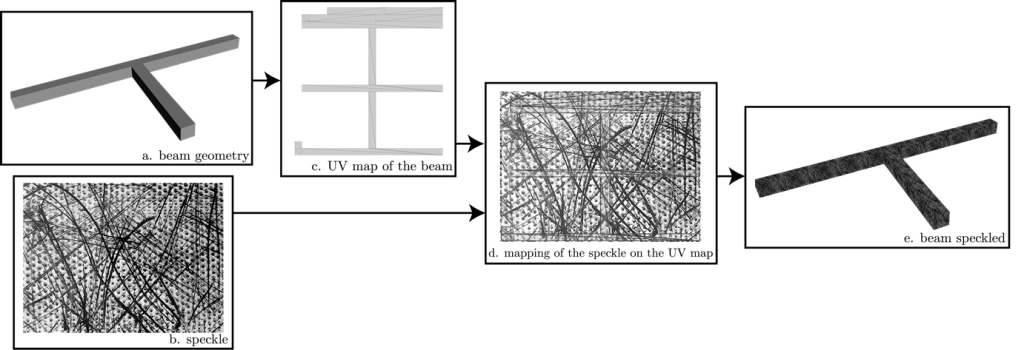
Figure 4 – Stages for beam speckling in Blender: the 3D structure (a) is unwrapped, creating a UV map (c) on which the texture pattern (b) is applied (d). The unwrapped structure is then wrapped again (e)
4. Surface coverage and obscuration
This sections details essential aspects of the modeling of the experiment, during which we will cover subjects such as the choice of the camera, its positioning in the 3D space in order to avoid possible obstructions of objects (Newport bars, lamps, …), the surface coverage of the target zones, the influence of the lighting and the apparition of shadows due to possible obscuration that may degrade the digital image correlation results. In order to cover those elements, one can imagine that the position of the experimental device and the sample are known and that the position of the cameras has to be defined along Newport bars.
Numerous parameters of the cameras can be specified into Blender, such as the size of the sensor, the depth of field or the focal length of the lens. This allows to determine the surface coverage for different configurations of ensembles {camera+lens}. Once the initial scene set up, it makes it easy for the user to make the best {camera+lens} choice and position in order to avoid obstructions from objects of the scene or hint at determining a priori the best configuration for the digital image correlation test. Once the obstructions are avoided, one must ensure that no obscuration may degrade the test.
Lighting is also an essential matter when performing digital image correlation. Finely modeling LED lamps is a very important aspect to improve the quality of the test. In the same way the cameras are positioned, light sources can be added to the virtual scene and improve the design of the experiment, keeping in mind that one must ensure that no element (light source, camera, Newport bar or even cable) will generate shadows on the areas of interest. All those elements can rather finely be added to the 3D scene when necessary.
Blender contains useful features that allow one to represent light sources and the projected shading of the objects on the scene: for example, both direct and indirect light emissions can be taken into account, which is essential for multi-camera and multi-light sources experimental configurations with numerous possible obstructive objects. Different light sources are used, with isotropic or specific emission directions (cone, square or rectangle, very useful for modeling LED panels), or taking into account (or not) the distance falloff. (An)isotropic shading effects can also be modeled, with a particular emphasis being done on the interpolation between light areas and shadowed areas which can induce noise during the digital image correlation post-processing.
All these features enable an accurate 3D representation of the experiment, the level of accuracy depending on the goal: static positioning, influence of the volumes of given elements, obstructions and creation of shadows, or a need for photo-realistic rendering for goal-oriented optimization.
5. Generation of virtual images
As an example, the result for the manual choice of cameras 7, 8 and 11 of the experiment is detailed here. First their approximate locations (Fig. 5) were decided to target the beam-column joint. Their sensors type and lenses (given in Tab. 1) were then chosen to obtain an approximate pixel size (large for camera 8 to measure the global displacement, small for camera 11 to catch accurately the displacement field on the joint surface). Last the aperture (Tab. 1) is fixed to ensure a sufficient depth of field.
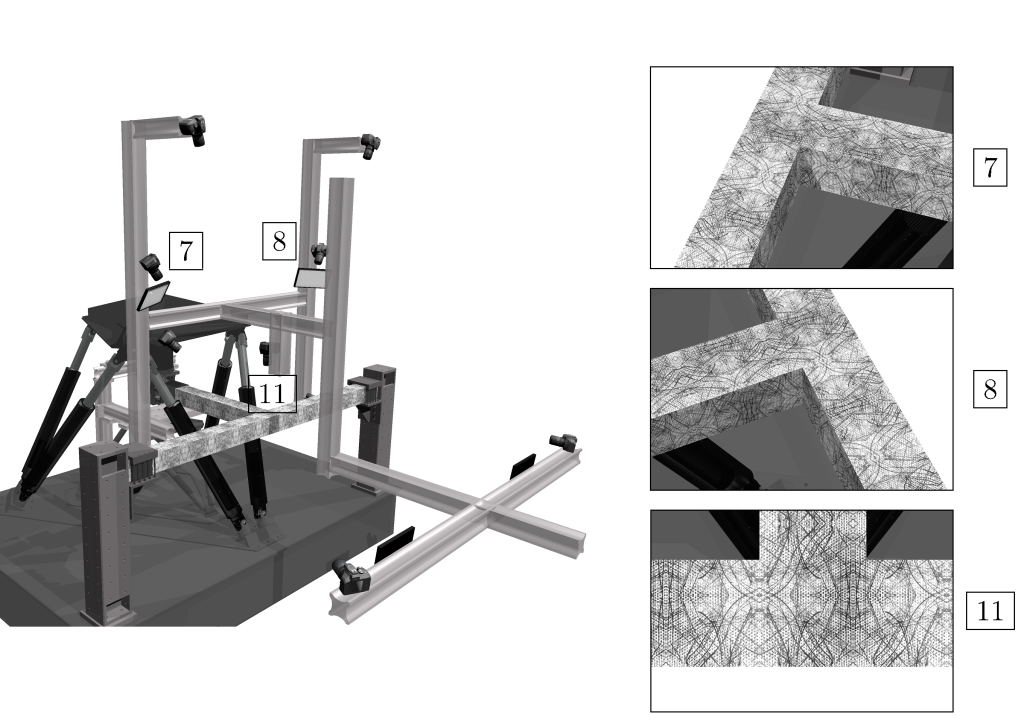
Figure 5 – Views of the generated virtual images for camera 7, 8 and 11 of the experiment
camera # sensor resolution lens Aperture (f)
11 (Canon 60D) CMOS 22.3 × 14.9 mm² 3456 x 2304 35 mm 15
7 (Canon 45D) CMOS 22.2 × 14.8 mm² 3088 x 2056 50 mm 15
8 (Canon 45D) CMOS 22.2 × 14.8 mm² 3088 x 2056 50 mm 15
Table 1 – Camera and lens specifications for three points of view
Conclusion
The complexity of the experiment is increasing, and the use of virtual testing is a great tool to reduce the time of preparation of such experiments.
The software Blender used in this work shows great advantages in this perspective: its first main ingredient is that it can generate photo-realistic images. It is to be mentioned that its development relies on a huge community of users and developers, which is a great advantage for developing new tools such as the ones mentioned in this article. The most useful feature of Blender is probably its Python interface, which allows the (not so easy) scripting of the process (as a way to automatize the rendering procedure) and the extraction and computation of the different parameters or operators, such as the pixel size or the image matrices, in order to perform goal-oriented optimization.
Today, Blender can be used to study the feasibility of digital image correlation tests by combining it with finite element simulation.
References
[1] J.-E. Dufour, S. Leclercq, J. Schneider, S. Roux, and F. Hild, “3D surface measurements with isogeometric stereocorrelation: Application to complex shapes,” Optics and Lasers in Engineering, vol. 87, pp. 146 – 155, 2016.
[2] J. C. Passieux, F. Bugarin, C. David, J. N. P´eri´e, and L. Robert, “Multiscale displacement field measurement using digital image correlation: Application to the identification of elastic properties,” Experimental Mechanics, vol. 55, no. 1, pp. 121– 137, 2014.
[3] Blender Online Community, Blender – a 3D modelling and rendering package. Blender Foundation, 2018.
[4] A. E. Iskef, Technologies informatiques pour l’étude du comportement expérimental et numérique d’un assemblage poutre-poteau en béton armé. PhD thesis, ENS Cachan, 2016.
[5] F. Hild and S. Roux, “Digital Image Correlation,” in Optical Methods for Solid Mechanics. A Full-Field Approach (P. Rastogi and E. Hack, eds.), (Weinheim (Germany)), pp. 183–228, Wiley-VCH, 2012.
[6] M. A. Sutton, J. J. Orteu, and H. Schreier, Image correlation for shape, motion and deformation measurements: Basic Concepts, Theory and Applications. New York, NY (USA): Springer, 2009.
[7] A. Stokes, M. Gardner-Morse, D. Churchill, and J. P. Laible, “Measurement of a spinal motion segment stiffness matrix,” J. Biomech., vol. 35, pp. 517–521, 2002.
[8] F. Motoyoshi, M. Takanori, I. Tadashi, K. Takaya, K. Yuichi, and I. Satoru, “Development of 6-Axis Material Tester for Measuring Mechanical Spine Properties,” J. Robot. Mechatron., vol. 18, no. 2, pp. 160–166, 2006.
[9] J. G. Michopoulos, J. C. Hermanson, and A. Iliopoulos, “Towards a recursive hexapod for the multidimensional mechanical testing of conmposites,” in International Design Engineering Technical Conferences & Computers and Information in Engineering Conference IDETC/CIE 2010, 2010.
[10] B. Ding, R. M. Stanley, B. S. Cazzolato, and J. Costi, “Real-time FPGA Control of a Hexapod Robot for 6-DOF Biomechanical Testing,” in 37th Annual Conference on IEEE Industrial Electronics Society, 2011.
[11] M. Ismail, “Novel hexapod-based unidirectional testing and FEM analysis of the RNC isolator,” Struct. Cont. Health Monit., vol. 23, no. 6, pp. 894–922, 2016.
[12] A. Carpiuc-Prisacari, M. Poncelet, K. Kazymyrenko, F. Hild, and H. Leclerc, “Comparison between experimental and numerical results of mixed-mode crack propagation in concrete: Influence of boundary conditions choice,” Cem. Concr. Res., vol. 100, pp. 329–340, 2017.
98-100 AVENUE ARISTIDE BRIAND
92120 MONTROUGE
FRANCE