Digital Image Correlation (DIC) for vibration analysis
- By Floriane Soulas, R&D Engineer at EikoSim
Digital Image Correlation (or DIC) is well-known for its static applications, but under the right circumstances, it is equally applicable to vibration testing. Here is an industrial example at Safran.
As part of the development of increasingly high-performance aircraft actuators, Safran Landing Systems (SLS) must ensure the integrity of its systems during commissioning. With this in mind, the test discussed in this article is dedicated to so-called “actuator vibration” tests (Fig. 1).
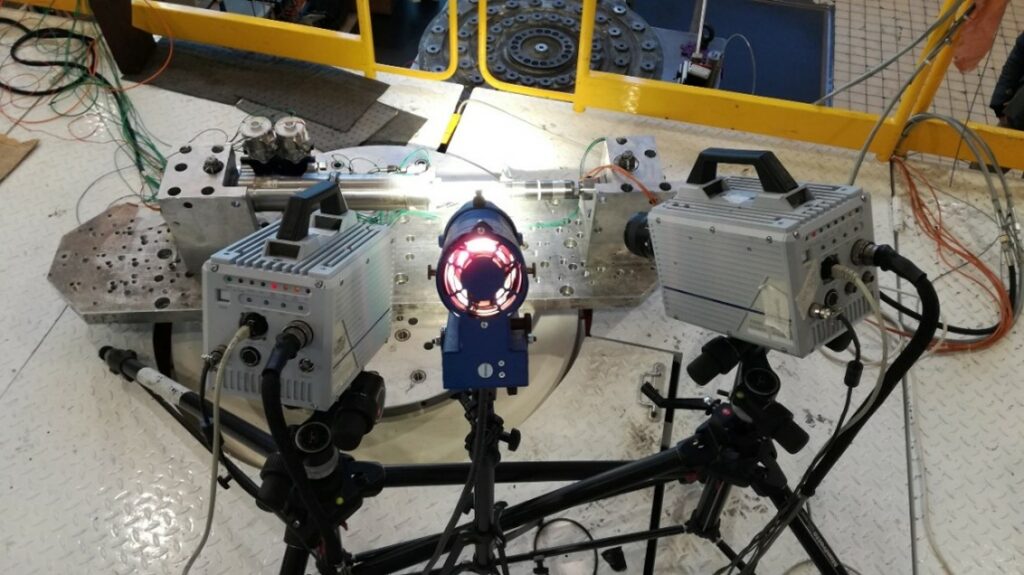
Vibration tests on a hydromechanical actuator were carried out with stereo-image correlation monitoring. During these tests, real-time monitoring of the actuator response to the applied load, recommended by the associated standard, is carried out. The objective is to quantify the displacements imposed by the vibrating pot by stereo-correlation to ensure the structure’s performance while guaranteeing passenger safety.
Vibration tests on two axes (axis 1 and axis 2) and for two resonance modes (frequencies f1 and f2, respectively) are performed on a pressurized cylinder in order to measure the maximum deflection of the structure, and to ensure the validity of the corresponding numerical model. Such tests are expensive and the levels recommended by the validation standards are severe and can cause damage to the tested structures when they are brought to failure.
Vibration monitoring by stereo-DIC measurement
As shown in Figure 1, we have positioned a pair of high-speed cameras (1000 fps, 2048×2048 pixels) in front of the actuator (Fig. 1). Thanks to EikoTwin DIC, it is now possible to carry out the measurement directly on the Finite Element (FE) model provided by the simulation and to compare the measurement and simulation results directly with it.
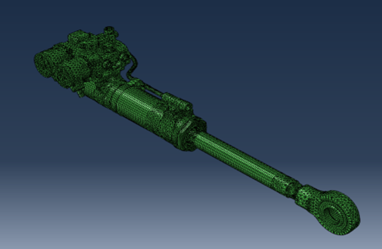
Since the EF model of the structure is extremely complex and refined, a lighter version, centered around the area of interest, has been re-cut. The maximum expected deflection is located on the top of the main cylinder (in red in Fig. 2).
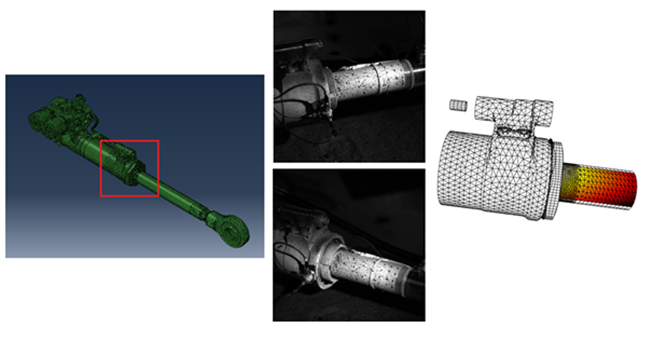
All displacement measurements will then be extracted from this point corresponding to the maximum deflection. Thus, a reduced study area (Fig. 3) was determined and it is in this area that the analysis and comparison was performed during the study.
The vibration tests were very long (several tens of minutes), and the fast cameras were able to record only a few seconds. Three recordings were carried out for each axis and each clean mode at the beginning, middle, and end of vibration, respectively.
It was noted that the eigenmode frequencies slipped during the test and proved to be different from those predicted by the simulation.
This may have an impact on the displacement amplitudes obtained and, thus on the test/calculation comparison, which will have to take this parameter into account.
Measurement results
The image processing software projects the measured displacements directly onto the finite element model provided by SLS, as shown in Figure 4.
The image correlation system captures the sinusoidal curve extracted at the point corresponding to the maximum eigenmode deflection (see Fig. 2).
The measurement has shown that the displacement fields obtained thanks to DIC during the vibration of the actuator are homogeneous and consistent with the predictions of the numerical model.
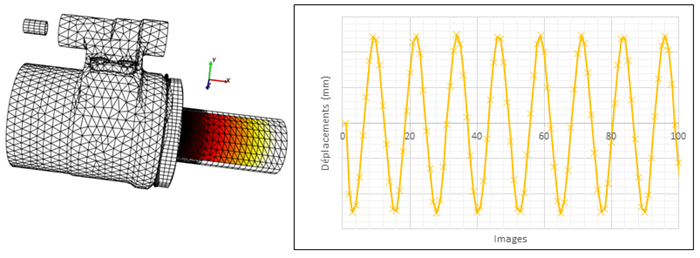
Moreover, by displaying the measurements directly on the EF model, it is possible to retrieve the value of the displacements at a given node for all images. Thus, it is possible to retrieve the maximum value of the arrow at the position predicted by the simulation and check whether the simulation predicted the right value and position.
The results in displacements measured and simulated at the point of interest (see Fig. 2) are gathered in tables 1 and 2, for axes 1 and 2, respectively. At the time of the first image taking (i.e., Start), the displacements obtained are close to those obtained by simulation. The frequency and amplitude show a decrease during the test (image taking “in the middle”) followed by an increase in amplitude at the end of the vibration cycle, which is found for both axes.
| Axis 1 (mm) for f1 | Attendu : 4,24 mm (for f1) | |
| Beginning (f = f1) | Middle (f< f1) | End (f< f1) |
| 4,00 | 2,57 | 3,77 |
| Axis 2 (mm) for f2 | Attendu : 3,73 mm (for f2) | |
| Beginning (f< f2) | Middle (f< f2) | End (f< f2) |
| 3,7 | 3,0 | 3,3 |
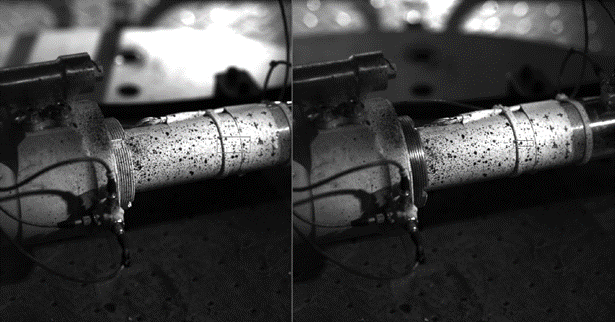
Finally, in this trial, image correlation was not only used to make displacement measurements. In fact, the measurement made it possible to highlight an unexpected behavior during the acquisition of eigenmodes. A rotation of a part of the actuator was highlighted, which had not been predicted by the numerical model, as shown in Figure 5.
This behavior may have several origins but was not visible to the naked eye when the structure was vibrated. The images taken by the high-speed cameras allowed us to highlight this rotation of the structure and thus provide important qualitative information on the assembly of the jack, which could have gone unnoticed even after the tests.
Despite the large displacement amplitudes experienced by the structure during its vibration, the DIC high-speed cameras were able to capture the entire kinematics of the structure’s eigenmodes. Subsequently, the processing of these images with the EikoTwin-DIC software made it possible to express the measurement directly on the finite element mesh of the part.
These tests thus enabled the SLS team to observe for the first time the displacement but also the overall behavior of the actuator during its loading. Thanks to the information collected, their predictive numerical model was improved.
Conclusion
In conclusion, the measurement carried out showed displacement fields, obtained during the eigenmodes, homogeneous and consistent with the numerical simulation predictions.
The test also highlighted unexpected behavior. Contrary to what had been predicted by the numerical model, DIC measurements show that the actuator seems to undergo a rotation of its central cylinder, during vibration.
This very fine rotation was captured by the high-speed cameras but could have gone unnoticed, as it was invisible to the naked eye. Highlighting this behavior provides important information for test engineers on the assembly of the structure and its behavior in service.
Test data was collected in this area for the first time. These tests are encouraging and provide qualitative and quantitative results in study areas never previously measured, allowing them to enrich and optimize their numerical model in order to use it in their validation processes for hydromechanical jack type structures.
98-100 AVENUE ARISTIDE BRIAND
92120 MONTROUGE
FRANCE