
Modal analysis is a key technique used in engineering to understand the vibratory behavior of mechanical structures. It enables us to determine the natural frequencies and modal shapes of a structure, which are crucial in ensuring that it does not resonate dangerously under specific operating conditions.
Traditionally, this analysis has relied on the use of point accelerometers, which provide partial results on the modal shapes of structures. Thanks to its ability to provide field measurements, Digital Image Correlation (DIC) opens up new perspectives for modal analysis.
The aim of this article is to evaluate the possibility of determining the modal shapes and frequencies of a structure using a DIC analysis. To this end, synthetic test data have been generated and exploited with the aim of validating the proposed method in a controlled environment before applying it to concrete industrial cases. This article presents the approach used to generate virtual images with a reference field calculated by finite elements, followed by the results of this study.
Simulation of vibration behavior using the finite element method
A 600 mm long model wing fixed at its base was used for this study. Using the Abaqus solver, the first five modes of the model were determined (see Figure 1).

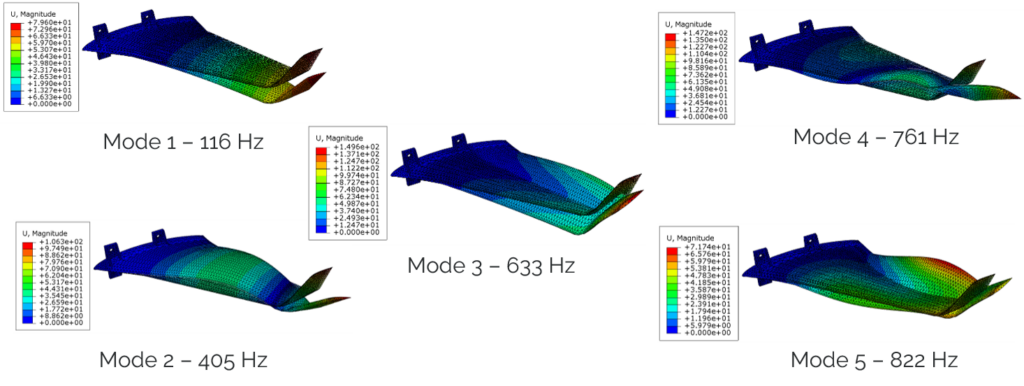
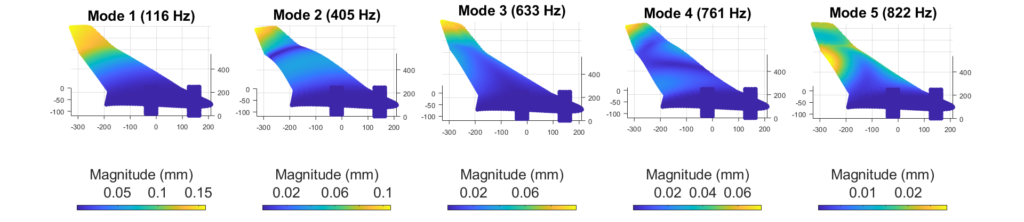
As the calculated maximum amplitudes of the modes make no physical sense, different scaling factors were applied to the five spatial modes in order to apply realistic displacements to the model (see Figure 2).

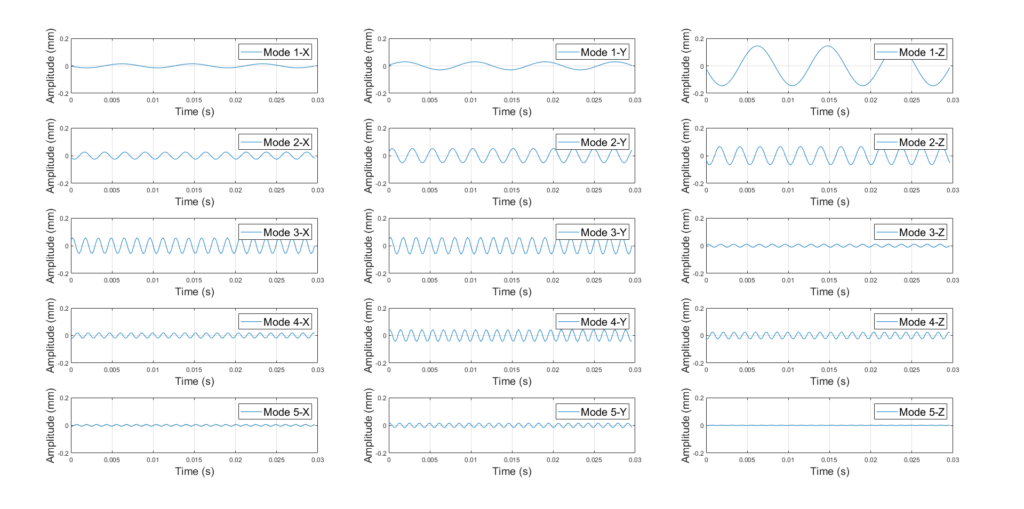
For each modal field, a sinusoidal amplitude was generated for a duration of 30 ms, i.e. around three times the vibration frequency of the first mode. According to Shannon’s theorem, the sampling frequency must be greater than twice the maximum frequency present in the signal. To account for measurement errors, a sampling frequency of 5000 Hz was used, i.e. around six times the vibratory frequency of the fifth mode. Figure 3 shows these amplitude curves for a node located on the winglet.

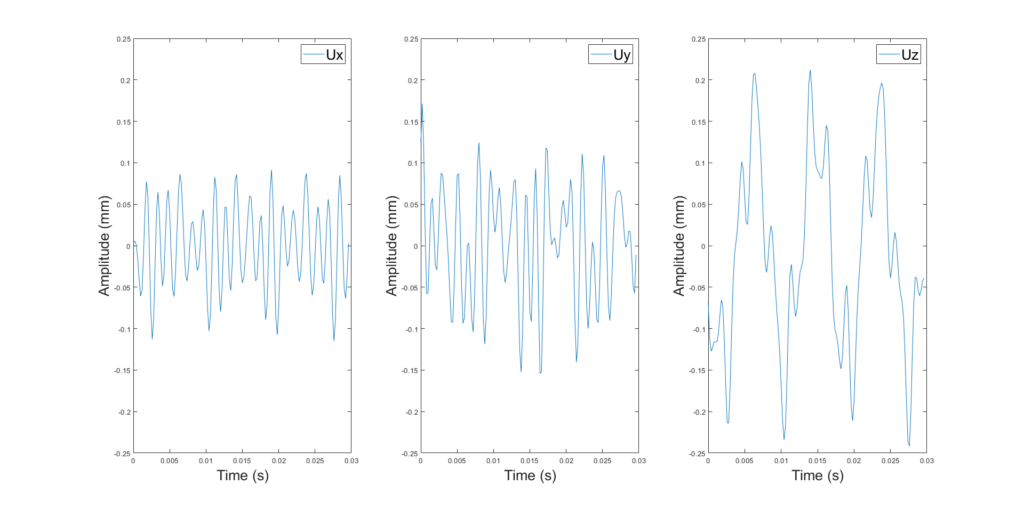
These fields were summed for each node to generate a vibration behavior that contains a contribution from all five modes. Figure 4 illustrates this superposition for a node located on the winglet.
Virtual image generation with EikoTwin Virtual
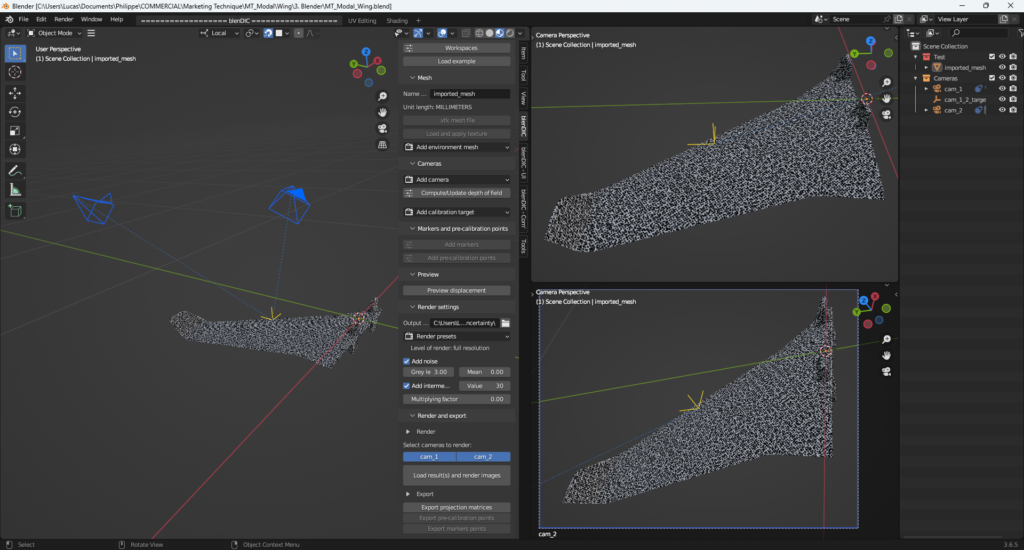
EikoTwin Virtual, based on Blender, is used to generate photorealistic images from a finite element model and the characteristics and positions of the cameras used (see Figure 5). Cameras with a resolution of 1280 x 960 px and a 25 mm lens located at a distance of around 800 mm from the part were modeled. From the previously generated vibration behavior, the finite element model was deformed and series of images were exported, thus constituting synthetic test data.

Displacement field measurement for modal analysis with EikoTwin DIC
EikoTwin DIC enables displacement fields to be measured by correlating digital images directly on a finite element mesh. Using the synthetic images generated previously, the displacements of the vibrating wing were measured on its upper surface (see Figure 6). By applying noise to the reference image, the measurement uncertainty was estimated at 5 microns, or one-fifth of the amplitude of the fifth mode.
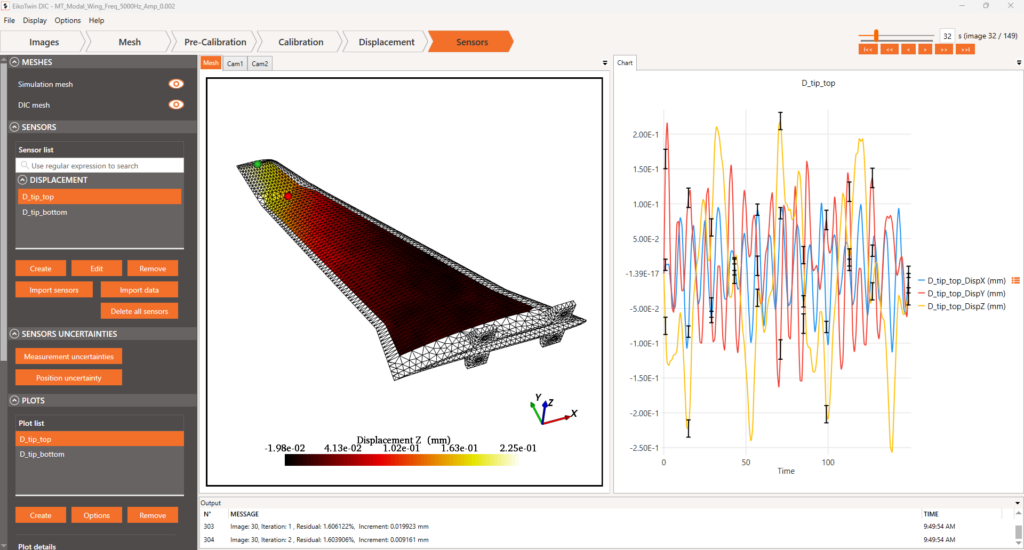
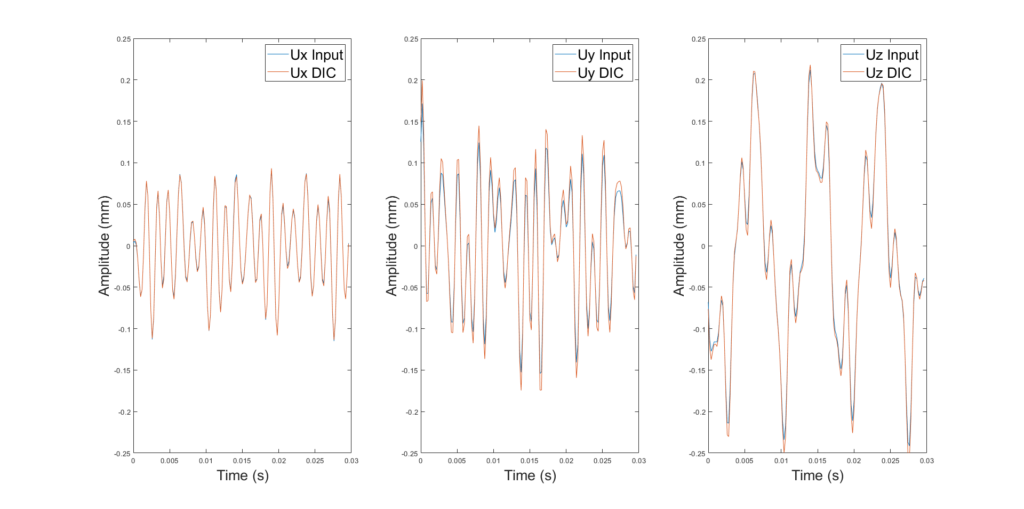
Figure 7 shows the comparison between the vibratory behavior given as input (U Input) and the vibratory behavior measured with EikoTwin DIC (U DIC) for a node located on the winglet.
Determination of modes by SVD and associated frequencies by FFT
The Singular Value Decomposition (SVD) method was applied to the entire displacement field measured by DIC to estimate the first five modes. This method approximates a data set by decomposing it into three lower-ranked sets. In this case, the first set corresponds to the temporal modes, each of which is associated with a spectral density (second set), and a spatial mode (third set). Figure 8 shows a comparison between the first 5 spatial modes used to generate the synthetic case and those measured, each at maximum temporal amplitude.
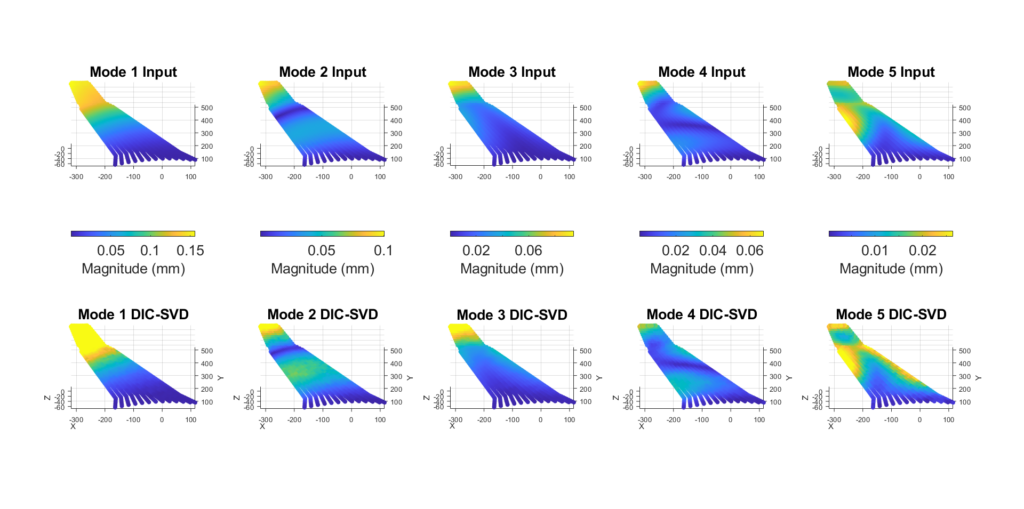
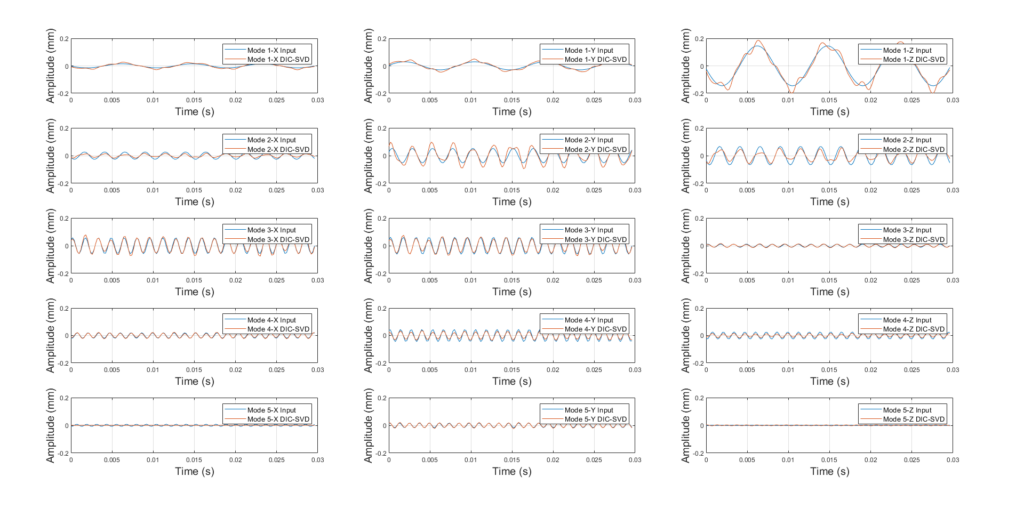
Figure 9 shows a comparison of the sinusoidal input signal (Input) for each mode and direction with the temporal modes obtained by SVD for a node located on the winglet (DIC-SVD).
The Fast Fourier Transformation (FFT) method was applied to each temporal mode obtained by SVD from the entire field measured by CIN to estimate the frequencies of the first five modes. The table below compares the input eigenfrequencies for each mode with the eigenfrequencies estimated by FFT for a sampling frequency of 5000 Hz and for a sampling frequency of 2000 Hz (closer to the boundary condition of Shannon’s theorem).
| Mode | Input (Hz) | DIC-SVD-FFT (5000 Hz) | DIC-SVD-FFT (2000 Hz) |
| 1 | 116 | 117 | 125 |
| 2 | 405 | 410 | 406 |
| 3 | 633 | 645 | 656 |
| 4 | 761 | 762 | 781 |
| 5 | 822 | 820 | 844 |
Results
The spatial modes determined using DIC and SVD show a very similar trend to the input spatial modes. Modal frequencies determined using DIC, SVD and FFT showed very good agreement with those derived from FEM analyses. For example, for the first mode, the frequency calculated by FEM was 116 Hz, while that determined by DOC was 117 Hz, demonstrating the accuracy of the method for this vi. This accuracy was maintained for the other modes.
The study was carried out both with a sampling frequency of 5000 Hz, i.e. around six times the maximum natural frequency of the selection, and with a sampling frequency of 2000 Hz (i.e. twice the maximum natural frequency). The eigenfrequencies identified showed degradation, which was expected in accordance with the condition of Shannon’s sampling theorem.
Conclusion
This study has demonstrated that Digital Image Correlation (DIC) can be used effectively for modal analysis. This method offers a new approach to modal analysis, particularly useful in situations where direct contact measurements are difficult to perform. This approach opens up new prospects for engineers, offering them a powerful tool for validating and refining simulation models.
Future prospects for this work, in addition to its application to real cases, are the application of this method to vibratory behavior computed by numerical simulation under loading, and the coupling of DIC data with accelerometer data.