![]()
In the context of crack propagation tests on composite material, EikoTwin image correlation solutions were used to meet a customer’s need. A post-processing script, exploiting the measurement data from EikoTwin DIC, was developed by EikoSim to bring satisfaction to the customer with a tailor-made solution.
This work is part of Paul Nicolino’s engineering internship at EikoSim, who graduated from INSA Lyon in 2021 in Mechanical Engineering.
Standardized tests and old measurement methods
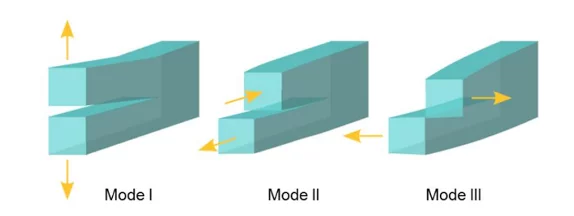
In the aerospace industry, a good knowledge of the fracture behavior of materials used in the design of mechanical parts is essential. In the particular case of crack propagation, there are 3 cracking modes (I, II, and III, see below).
There are several types of tests that can be used to study a particular cracking mode or combination of modes. The work performed in this study uses only the DCB (Double Cantilever Beam) test.
This test is regularly chosen in research work because it is characterized by the fact that it stresses only mode I.
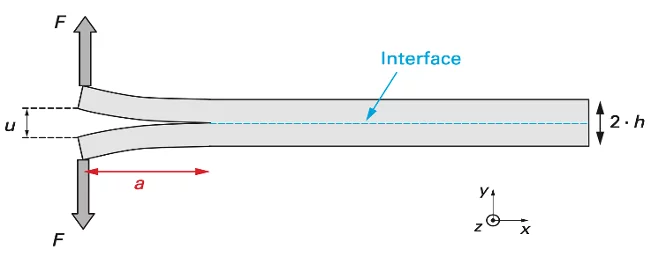
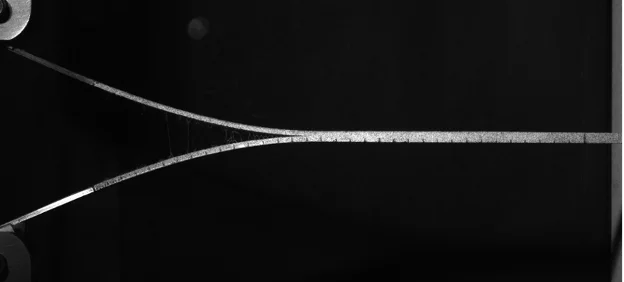
According to the ISO 25217 standard (“Determination of the mode 1 adhesive fracture energy of structural adhesive joints using double cantilever beam […] specimens”) used for this project, the specimen is left free on one side (right end on the diagram and the picture below).
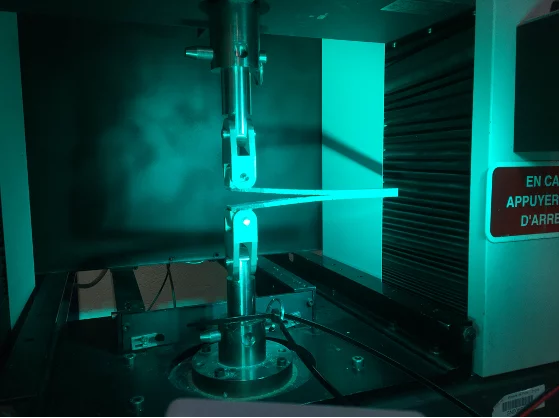
The crack propagation is generated by applying a vertical force on each arm, via swivel joints mounted on a traction machine.
Knowing the length of the crack during the DCB test makes it possible to determine the critical energy restitution rate in mode I, noted
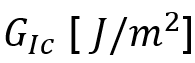
Physically, the energy restitution rate corresponds to the energy released by the crack to advance by one unit of surface. This quantity thus makes it possible to quantify the capacity of a material to resist the propagation of crack (sometimes called tenacity).
A first experimental method to measure the crack length is to use gauges placed on the cracking zone and whose filaments are cut one after another when the crack propagates. This method has the major disadvantage of being able to provide only a discrete result of the crack advance during the test, with relatively few measurement points and for a long instrumentation time.
Another commonly used method to measure consists in acquiring test images where the white-painted specimen is placed in front of a black background to distinguish the crack clearly. The pixel at the crack tip is then manually located during the test, which makes it possible to determine the crack length at each image by knowing the physical size of the pixel.
There are several drawbacks to this practice. For one thing, manually plotting the pixel position at the crack tip for each image is tedious and time-consuming. It seems unviable to perform crack tracking on a dozen or so trials, each comprising several hundred images.
On the other hand, the risk of error and the uncertainty of measurement are not negligible. There is also a subjectivity of measurement depending on the operator noting the position of the pixel.
In this context, Safran Aircraft Engines expressed its will to improve its DCB test procedure by wishing to automate the crack length measurement for each test by image correlation.
This is where the technical solutions developed and proposed by EikoSim come in, particularly the EikoTwin DIC software using digital image correlation.
Principle of digital image correlation
Digital image correlation is a measurement method that uses camera images to follow the displacements and deformations of a solid during its movement, such as a crack in propagation. It is very often used to follow and exploit physical tests in research and in the mechanical industry, and for very diverse applications, from material specimens through “subsystem” specimens (bolted assemblies, technological parts) to very large structures (a portion of an airplane or a helicopter, road or railway bridges and nuclear structures).
It has the advantage of being non-destructive, non-contact, and applicable regardless of the material or shape of the observed structure, provided that the region of interest can be filmed by cameras.
In this project, the tests performed will be single-camera, so we will only focus on 2D-DIC.
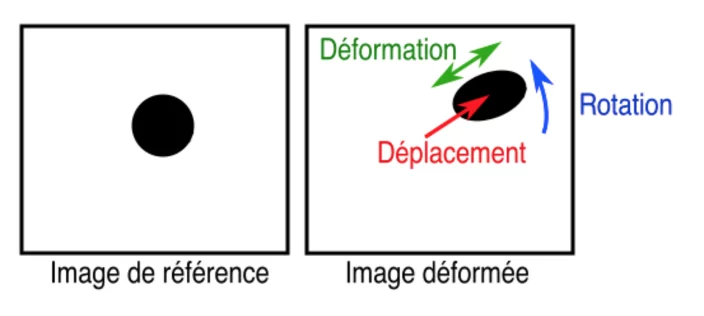
DIC consists in comparing two digital images of a structure taken by a single camera at two distinct instants of deformation, a so-called “reference” instant, and a so-called “deformed” instant. This comparison makes it possible to obtain the 2D displacement field at the origin of the movement between these two instants on the whole surface visible by the camera.
To allow the convergence of the DIC algorithm and especially to be able to observe the different states of deformation that the part experiences during the entire test, we cannot be satisfied with an image before the test and an image after. A set of intermediate images are taken and the comparison is made successively between all the images called “deformed” and the initial image called “reference”.
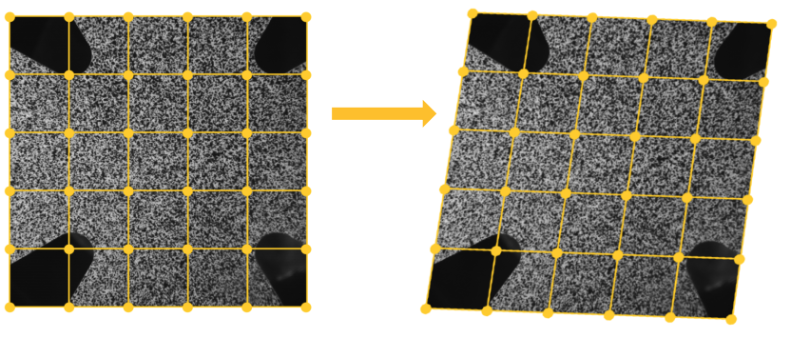
The fundamental principle of the image correlation technique is based on the assumption that the distribution of gray levels in the undistorted state of an image remains the same in its distorted state.
Ultimately, it is the gray level distribution characteristic of a thumbnail that distinguishes it from others; hence the importance of a sufficiently random speckle to ensure that the gray level distribution of each thumbnail is unique.
Since the speckle follows the material movement, in order to respect the previous assumption of conservation of gray levels, the grid of thumbnails deforms with the part.
These principles briefly summarize the technology behind EikoTwin DIC. We refer you to the other blog posts for more details:
- https://eikosim.com/en/technical-articles/digital-image-correlation-the-basics/
- https://eikosim.com/en/technical-articles/technical-functionality-selection-of-the-measurement-mesh/
- https://eikosim.com/en/technical-articles/dic-global-method/
Application of image correlation to DCB crack propagation tests
Safran Aircraft Engines and EikoSim is a perfect example of the application of EikoTwin DIC software for a standardized mechanical test.
According to the software methodology, pre-calibration is performed to align the measurement mesh to the reference image after importing the test images and selecting the measurement mesh.
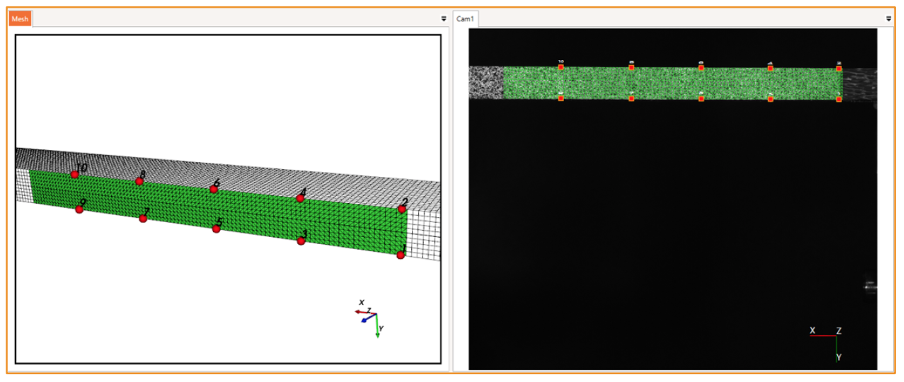
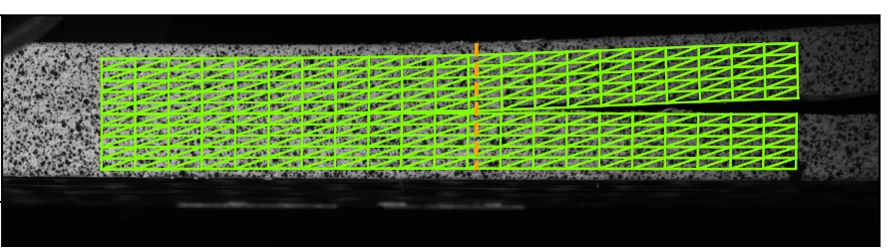
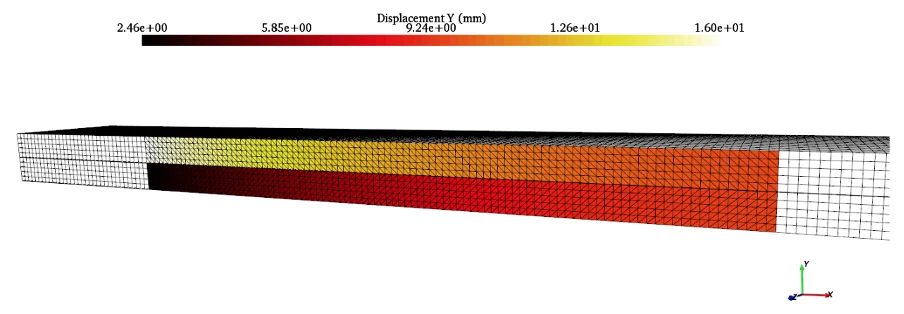
We can then proceed to the “Displacements” step, where the software measures the displacements at each time step using the series of images loaded in each camera. Here we can observe the vertical displacement field for a given image.
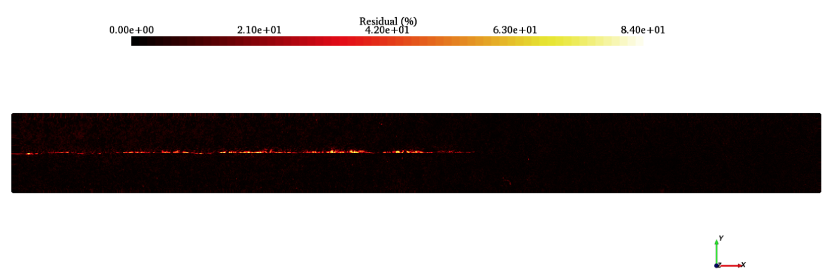
It is also possible to visualize the correlation residuals field. These residuals provide information on the computation’s quality and allow us to visualize the crack advancement after the image correlation measurement.
In order to obtain the best possible measurement data, we recommend some good practices for this type of test:
- Check for consistency between the digital model and the actual specimen (same dimensions, same spatial orientation, etc.).
- Frame the camera to view a relevant specimen length relative to the length you wish to measure.
- Make a speckle relevant to the dimensions of the image and the specimen.
- Set up a solid color background distinct from the specimen.
- Check the lighting: the brightness must be homogeneous on the whole specimen (no shadows or reflections) and must allow to distinguish it clearly from the background. Variations in brightness should be minimized on the specimen despite its movement during the test.
- Later, capture a series of images without imposed motion to determine the measurement uncertainties (“noise floor”).
We provide a spreadsheet on our website to determine the ideal speckle size to apply to the specimen.
Advancing the crack tip with the post-processing script
Once the study is completed, DIC makes it possible to export the displacement and strain results as .csv files. This functionality is particularly useful in this project to determine the crack advance during the DCB test.
The solution developed here is a Python post-processing script designed at the request of Safran Aircraft Engines to determine the crack length during the DCB test by exploiting the data exported from EikoTwin DIC. It works as followed:
- A study of the test must first be done with the EikoTwin DIC software to export the specimen’s displacement data.
- Once the calculation of the displacement fields is completed with DIC, the displacement data is exported.
- This data is organized as follows: each image is associated with a .csv file containing the displacements and the position along X, Y, and Z of each node of the measurement mesh.
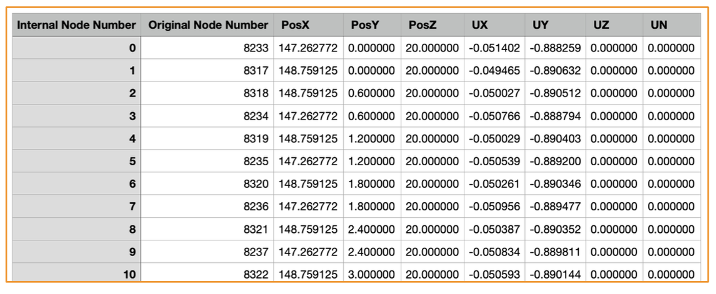
- Before running the script, the user specifies the values of two ordinates,
to select two rows of nodes on either side of the cracking interface.
- Nodes with equal abscissa are thus associated in pairs. For each pair and at each frame, the script determines the difference in vertical displacement :
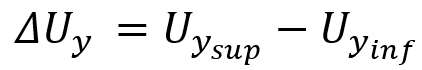
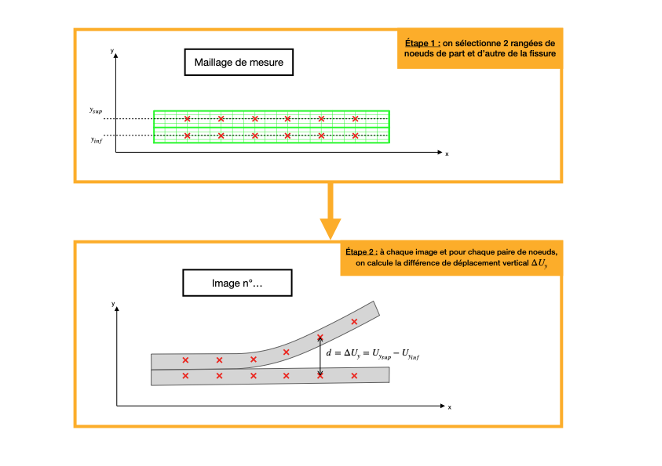
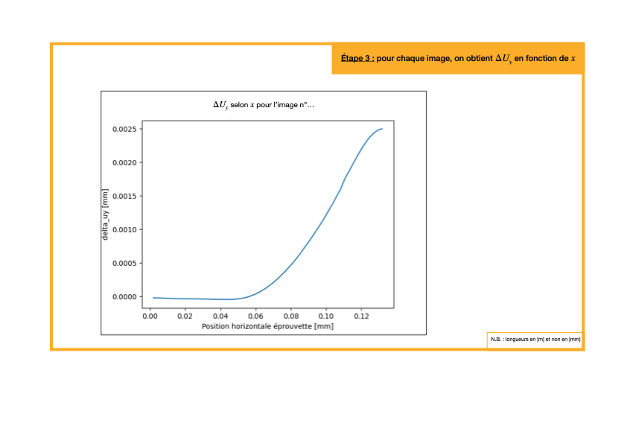
- The difference in vertical displacement is obtained for each pair of nodes, at each frame.
- For each frame, the associated horizontal position is noted when the vertical displacement difference reaches the crack opening criterion*.
*The script considers that a crack opening occurs when the relative vertical displacement between two nodes of the same pair exceeds 0,1 mm, :

The value of 0.1 mm was chosen according to the uncertainty of displacement measurements under DIC.
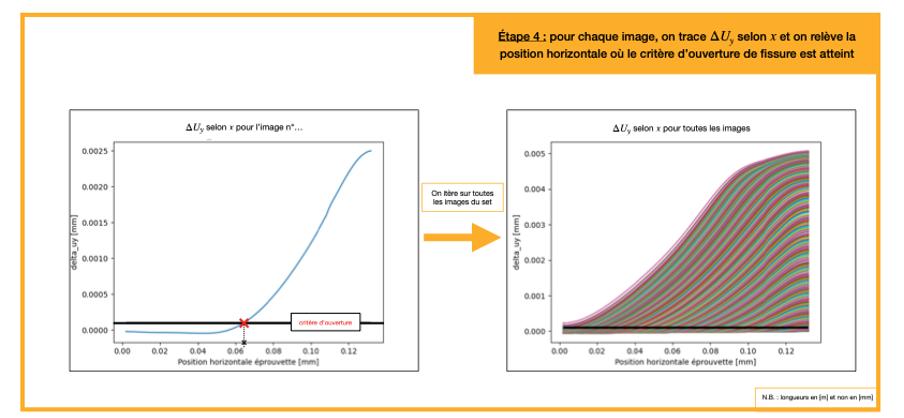
Repeating the previous operation for each image determines the horizontal position where the crack opening criterion is reached throughout the test.
In other words, we determine the crack length during the test.
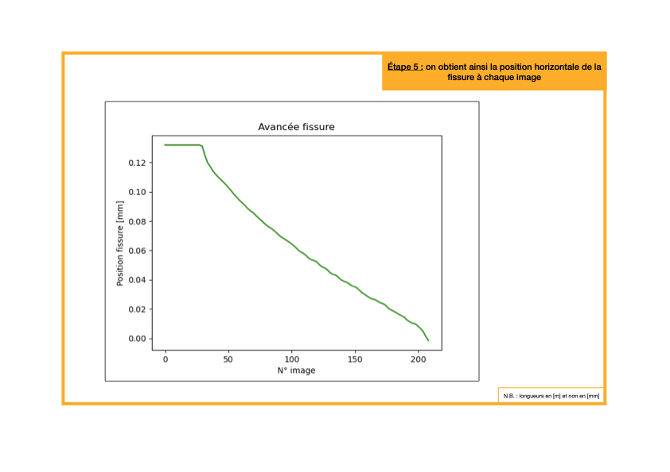
- At the end of the script, the user obtains the crack advancement graph as a function of the test images and a .csv file containing this data.
It is important to note that the crack position is expressed in the simulation mesh frame.
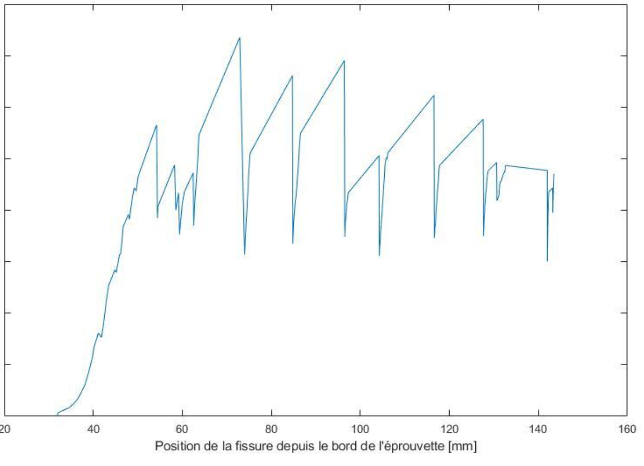
Combining the results provided by the script with the force data taken from the tensile machine, the following type of graph is obtained:
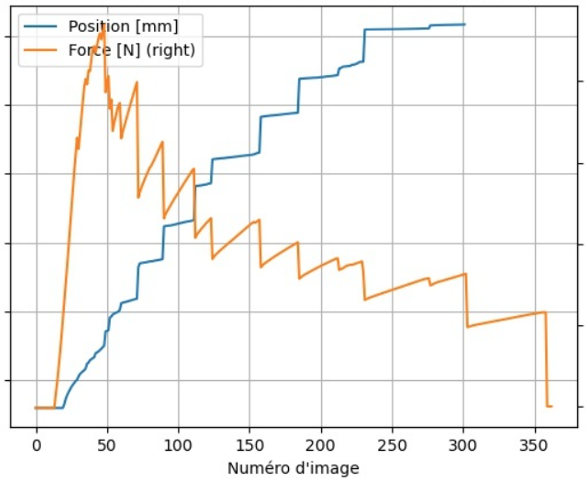
In the first image, the crack is considered to be at a constant position ???? = 35 mm. In reality, this means that the crack has not yet appeared in the measurement mesh, which is projected over the entire thickness of the specimen. The crack progresses continuously to ???? = 50 mm because of the pre-crack.
The correlation between the applied stress discontinuities and the crack jumps (“staircase” propagation) is indeed observed.
The knowledge of the position of the crack tip is essential in the experimental determination of GIc. Although this work does not fall within this project’s scope, we can show an example of a result obtained using crack-length data.
We find a behavior specific to a stick-slip type crack propagation, which justifies the use of the formula GIc from the Simple Beam Theory. The ISO25217 standard indicates that it is not relevant to try to average the GIc between the stop values and the initiation values.
Instead, the average values of the GIc between the stop and start values can be determined separately.
Summary
The digital image correlation measurement with EikoTwin DIC, combined with the post-processing script, makes it possible to avoid the subjectivity of visual crack length measurement.
On the other hand, the evaluation of the tests is now largely automated thanks to the script, and it is possible to increase further the time saving by using the batch mode of EikoTwin DIC.
![]()