![]()
- By Floriane Soulas, R&D Engineer at EikoSim
Context
In the context of monitoring large-scale production of automotive parts, many parts are subjected to repeated tests to ensure their integrity once they are put into service.
Thus, the test that we address in this paper is dedicated to the “gust of wind” tests of an opening structure (see Figure 1).
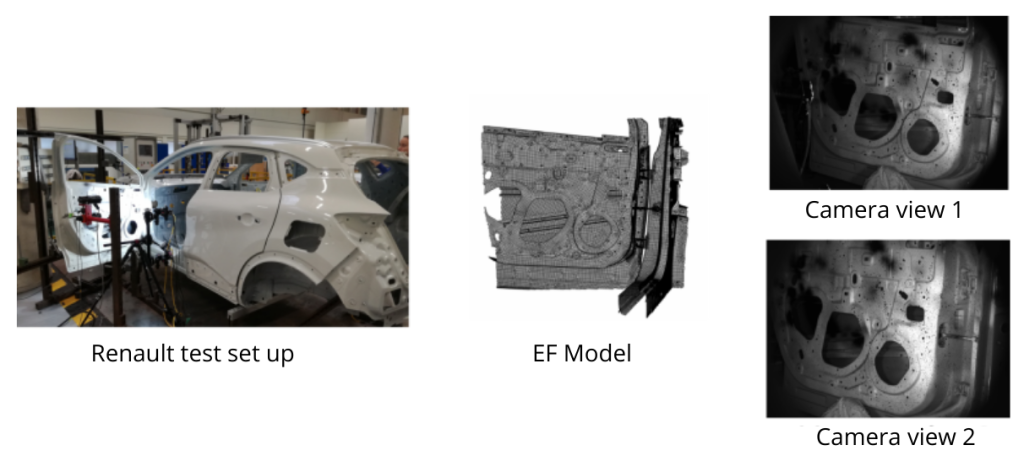
Loading tests on a door were carried out with a follow-up by stereo-correlation of images (DIC) in the premises of the Technocentre of Renault. The aim of these tests is to carry out a follow-up in real-time in order to quantify the displacements imposed on the door and explore image correlation for automotive purposes.
We thus seek to quantify in a global way the displacement field on the whole structure to ensure the validity of the corresponding numerical model. To do this, the door is brought to its stop and a progressive force is applied in steps on its end, reproducing an opening by a user.
This rigid body movement is extended beyond the door’s operating opening stop. In addition, between each load step, the door is returned to zero and returns to its initial position.
Displacement sensors (LVDT type) are placed at several locations on the door. A first wire sensor is placed at the end, at the level of the cylinder allowing the displacement. A second wire sensor is placed at the bottom of the door near the axis of the hinges. This second sensor will be compared with the image correlation results.
Displacement tracking by image correlation field measurement
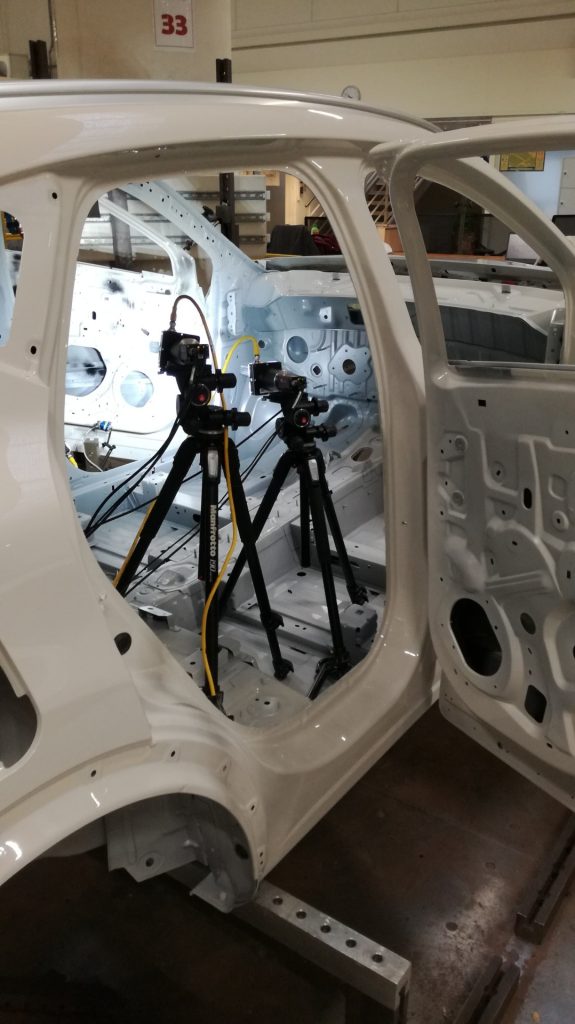
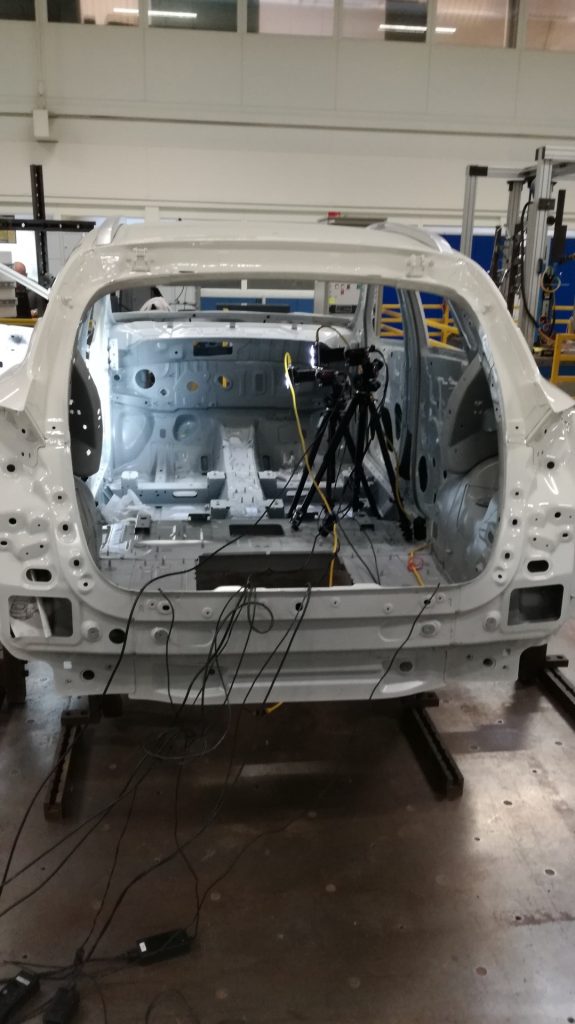
Following the indications of Figure 1, a pair of cameras is thus positioned opposite the door under the test (see Figure 2). The consequent size of the structure does not allow us to visualize the whole door and to carry out the analysis on all the surfaces with sufficient precision.
Therefore, a reduced study area (shown in Figure 3) was determined, and it is in this area that the analysis and comparison were carried out during the study.
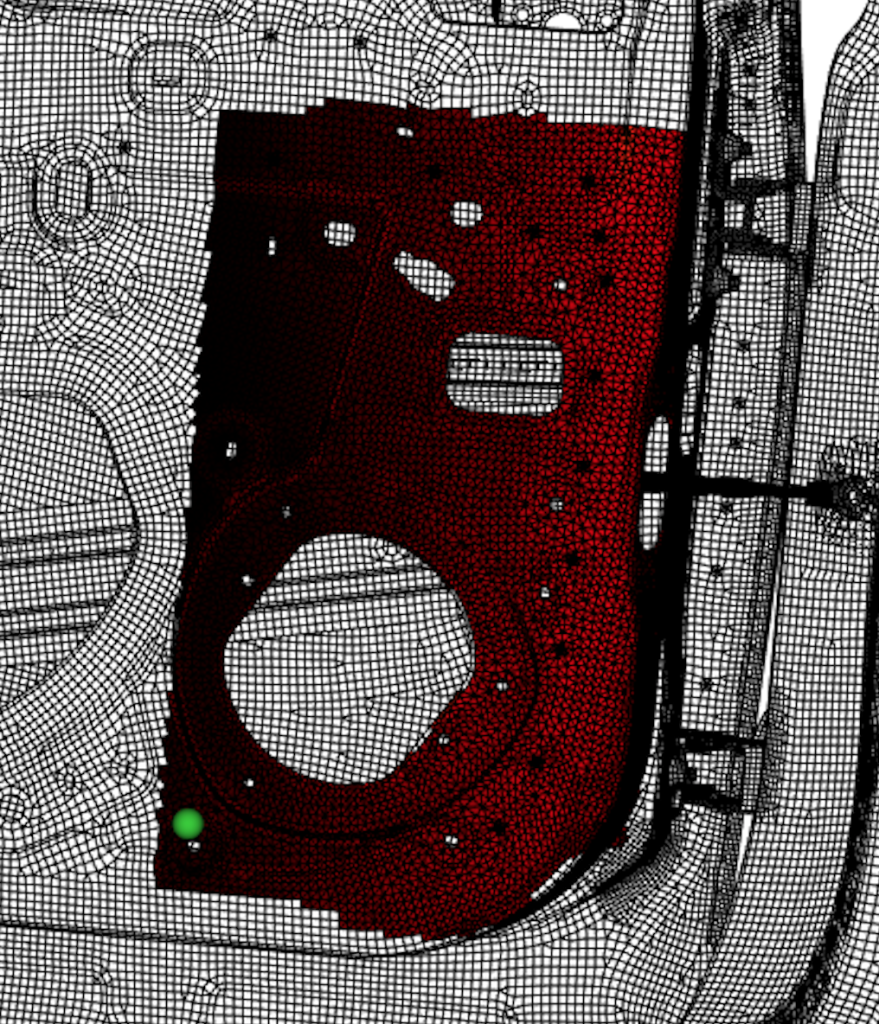
Despite the large rigid body movements of the part, the cameras can capture the entire door opening kinematics over the studied area, including the position of the wire sensor (green dot in Figure 3). The results presented in the following section will be scaled.
However, we note that the measurement is expressed directly on the finite element mesh of the part, which allows an immediate comparison with the displacement fields predicted by the design calculation for the considered stress.
Results and perspectives
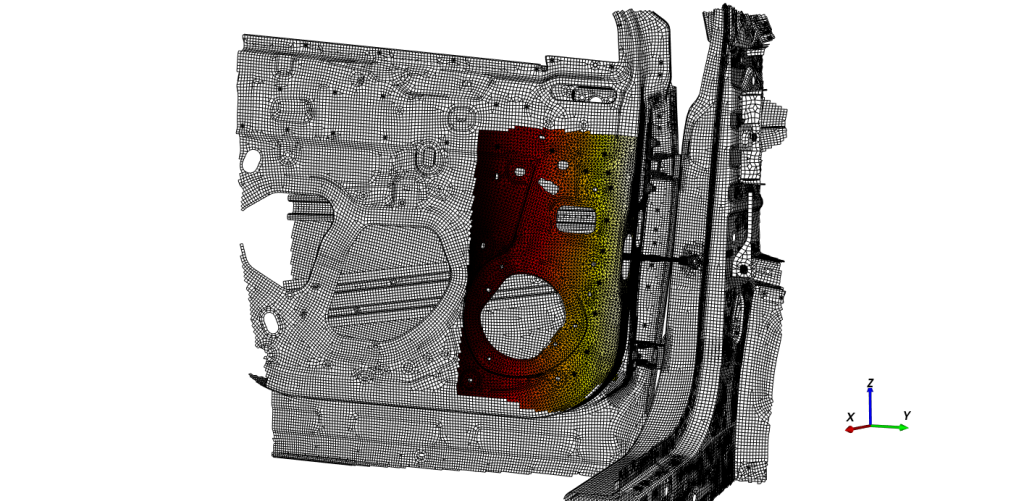
The measured displacements are projected directly on the finite element model provided by Renault, as shown in Figure 4. As expected, the door’s more important opening movement towards the exterior and the end than on the internal side is measured.
These results can also be found by looking specifically at the comparison with the wire sensor. To do this, a virtual displacement sensor (green in Figure 3) is placed on the mesh, using EikoTwin’s displacement sensor creation function, positioned at the actual location of the physical sensor.
Figure 5 shows the comparison between the two sensors for the first few load steps.
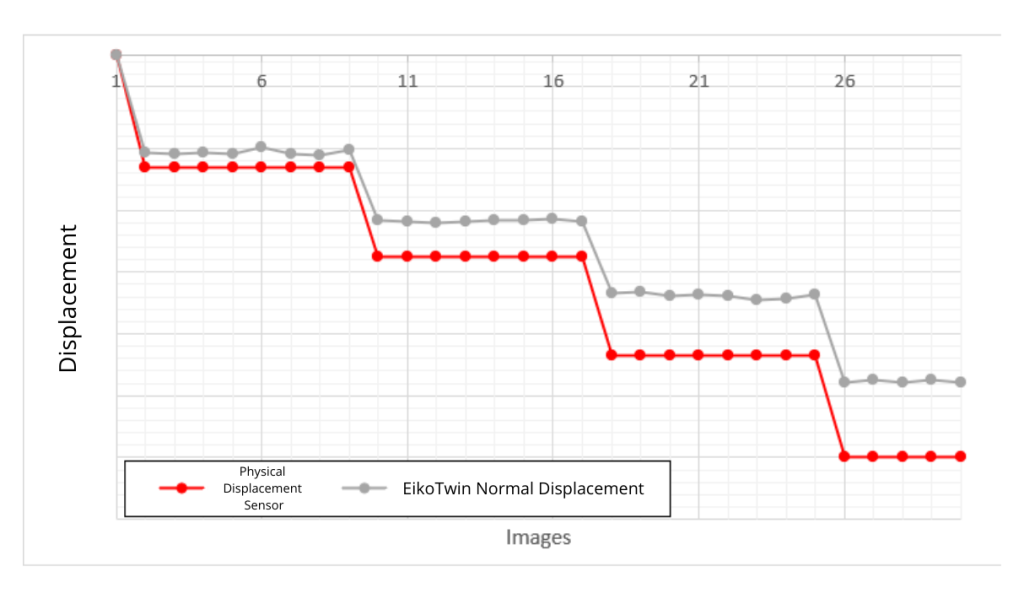
Here we see consistent displacement values between the real wire sensor and the DIC measurement. However, a discrepancy is present and becomes larger as the door opens. This discrepancy is due to the difference in normals between the wire sensor (sliding normal, which changes with the door’s opening angle) and the camera normal, which is fixed.
The optical measurement on the mesh has here an additional advantage for large displacements since it is not necessary to recalibrate it in the model frame.
It is also appropriate for this test to focus on the behavior of the door during the relaxation phases. Indeed, a return to the initial state is performed between each loading stage.
As predicted by the numerical model, it is expected that the door will return to its initial position between each step, which corresponds, in the measurement, to a return to zero displacement.
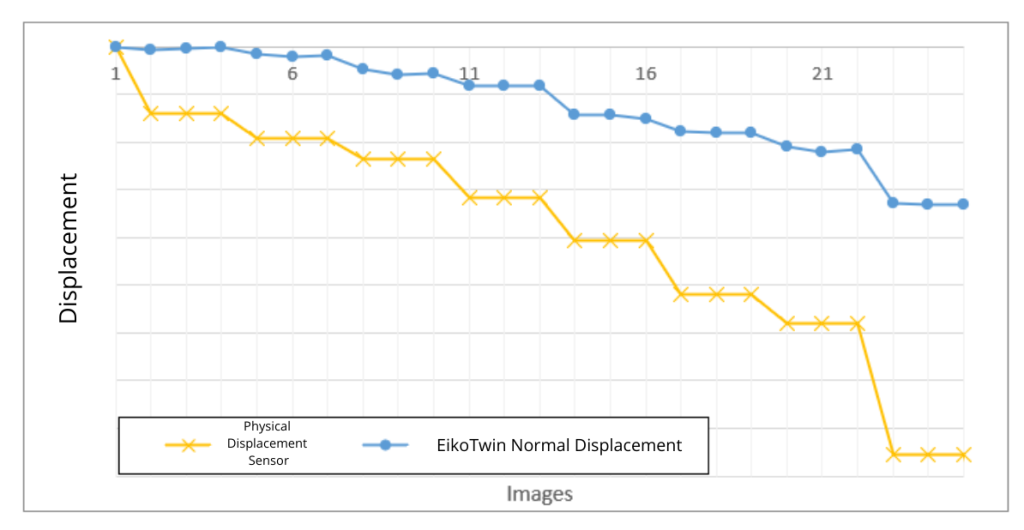
As shown in Figure 6, with the aforementioned deviation between the real and virtual sensors, the door does not return to zero between two loading phases, contrary to what was predicted by the numerical model.
Moreover, this deviation from the initial position increases as the imposed displacement increases, which is essential information for the future recalibration of the numerical model.
In conclusion, the measurement carried out showed displacement fields obtained during the load increase stages which were homogeneous and coherent with the tensile force applied and the wire sensor instrumented for this test.
However, a deviation was noted, due to the presence of a variable angle between the normal of the wire sensor and the movement of the door according to an angle that varies over time.
However, the test also revealed an unexpected behavior during the relaxation steps and the presence of residual displacement. Contrary to what was predicted by the numerical model, the door does not return to its original position between each step, as shown by image correlation but also by the wire sensor.
Test data has been collected in this area for the first time and shed light on the interesting asset of image correlation for automotive issues.
These tests are encouraging and provide qualitative and quantitative results in previously unmeasured study areas, allowing the update of the associated numerical model.
This study is the second EikoSim worked on with Renault.
![]()